VECTR Historical Trending
You can use the Historical Trending reporting view to analyze success rate over time.
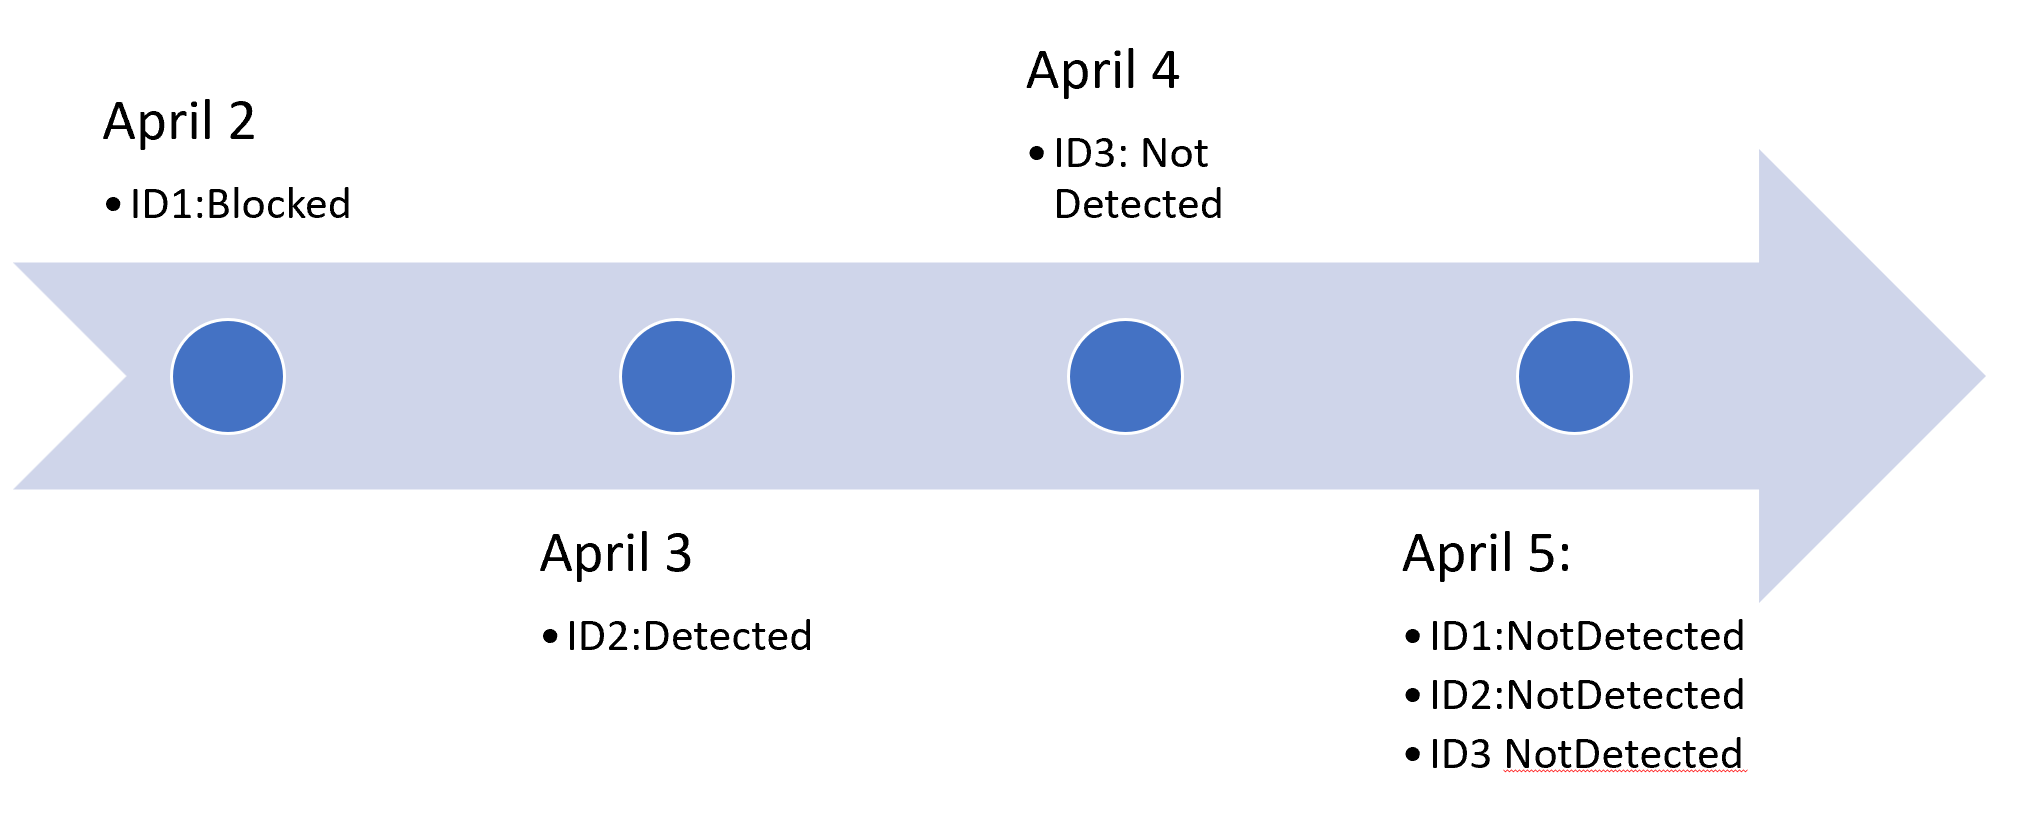
Setup
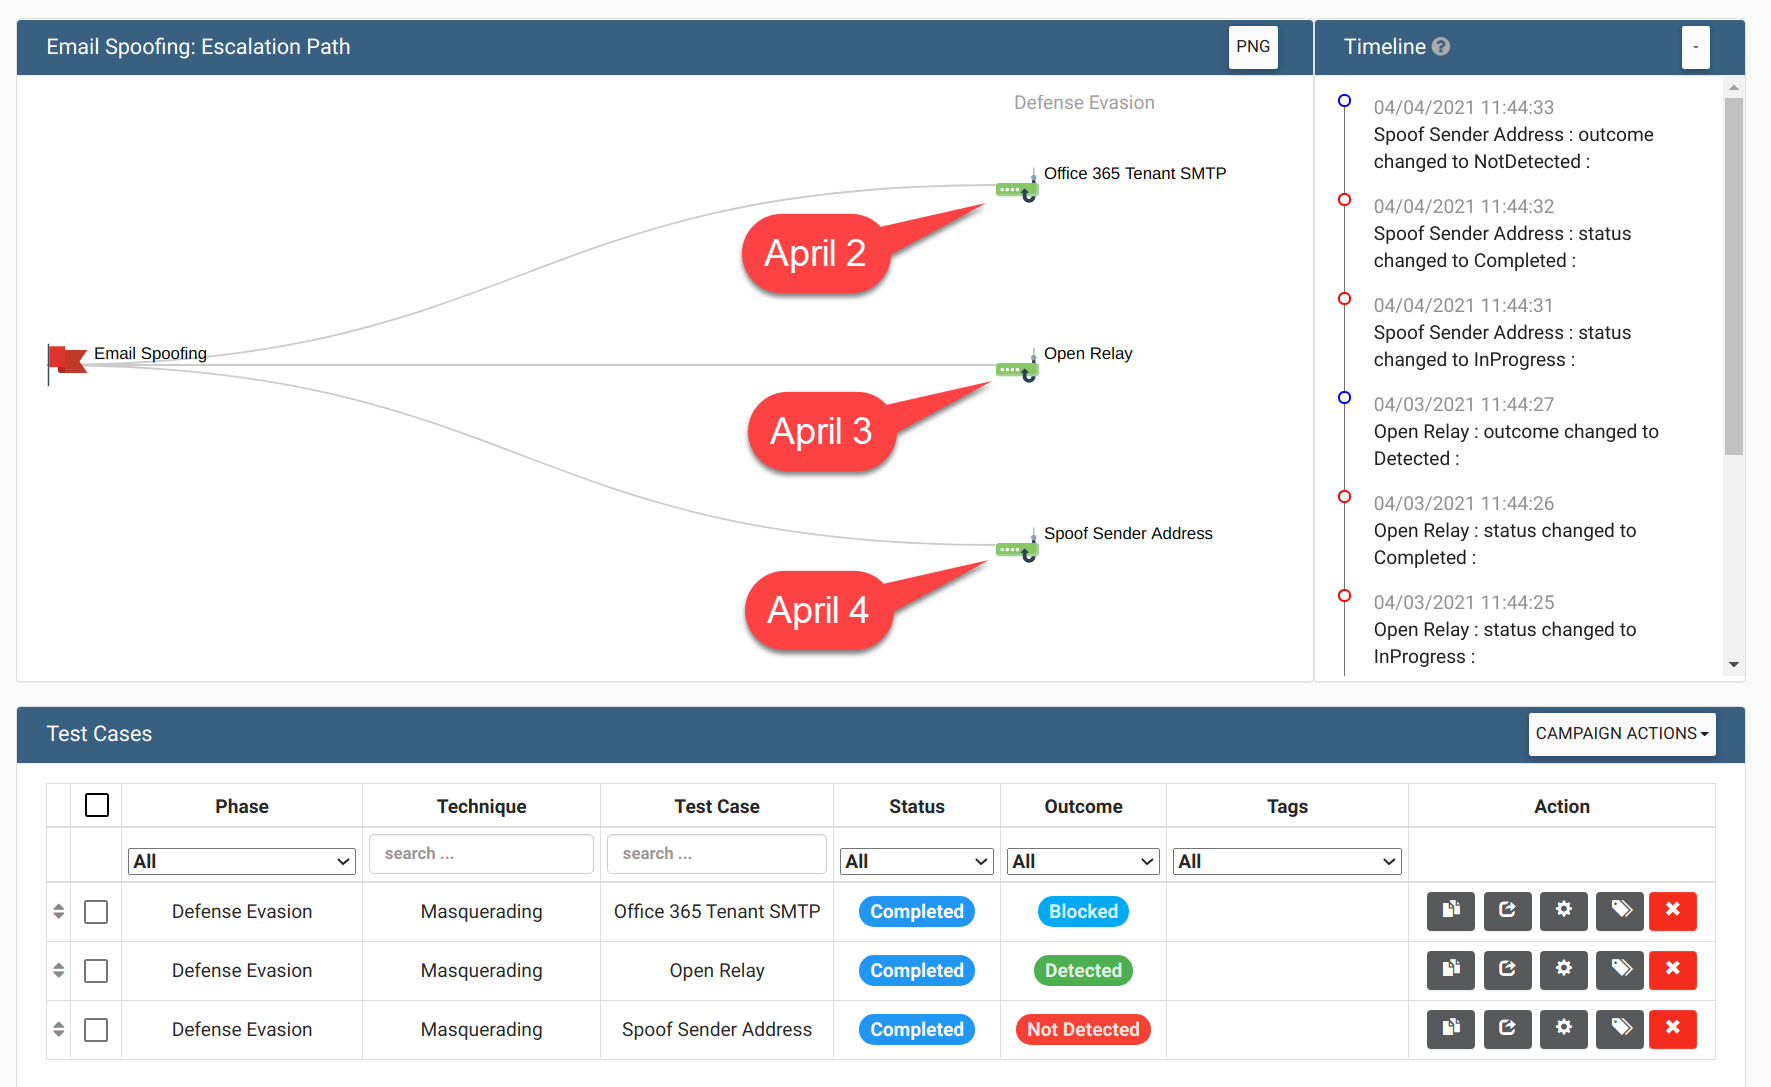
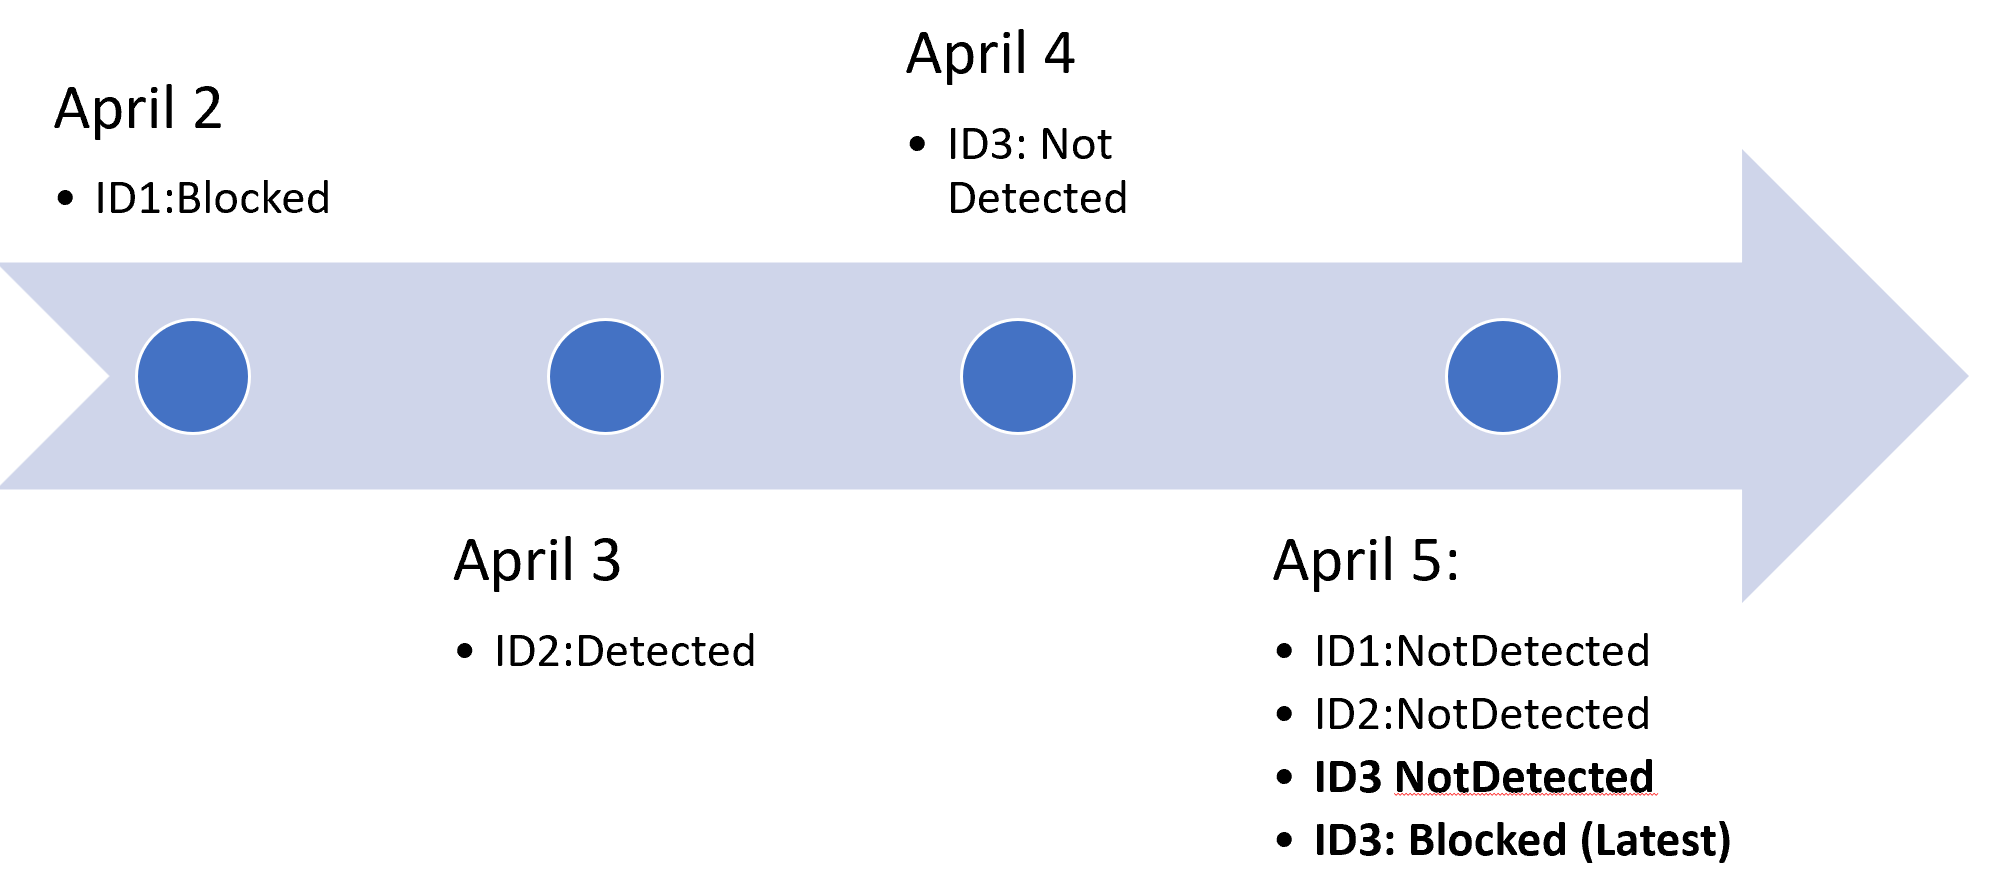
Initially 3 Test Cases, each performed 1 day apart. 1 Blocked, 1 Detected, 1 Not Detected. All have different TemplateIDs.
Aggregate vs Cumulative
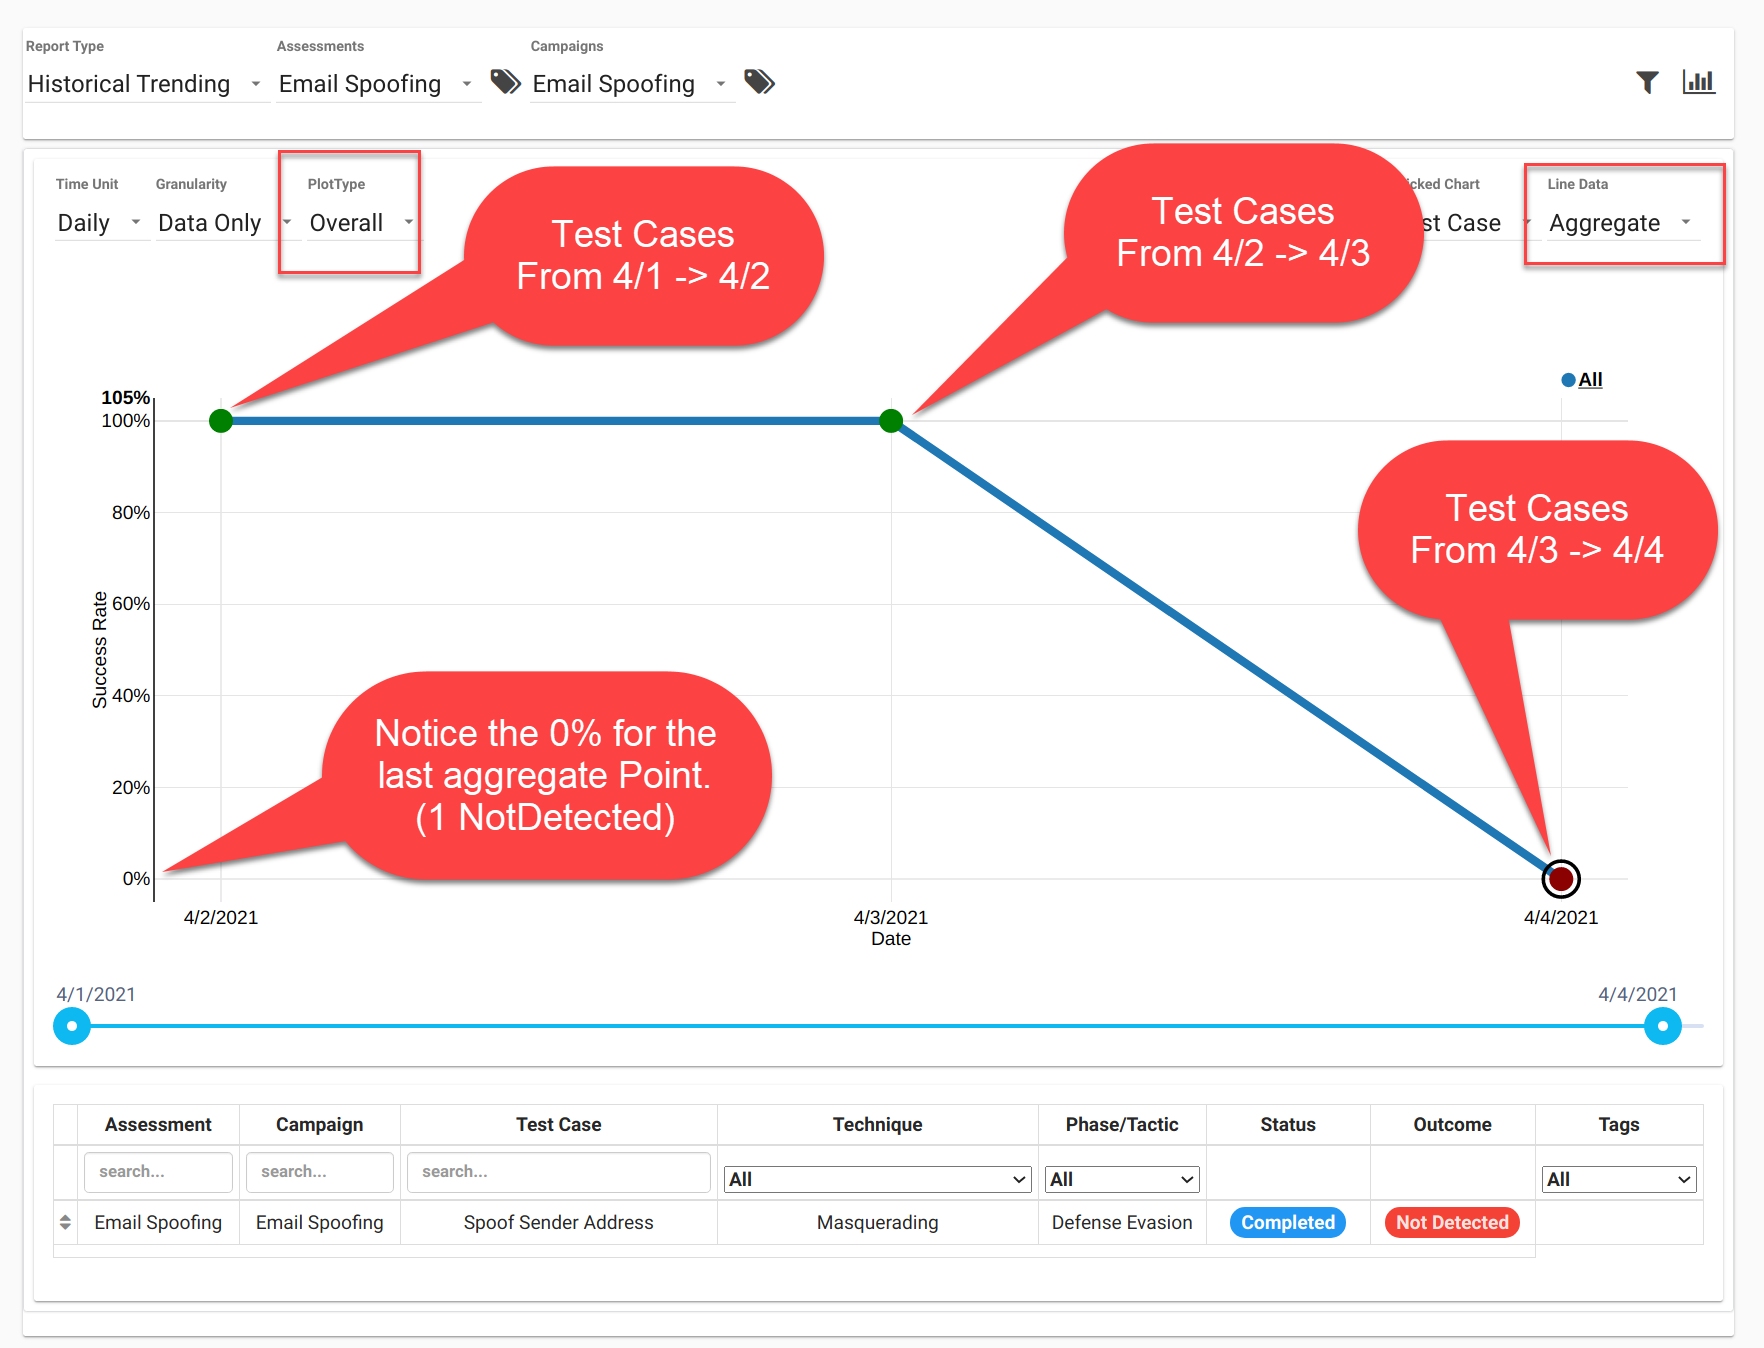
Aggregate
Aggregate Points calculate success rate based on all test cases from the previous point’s date to the point’s date.
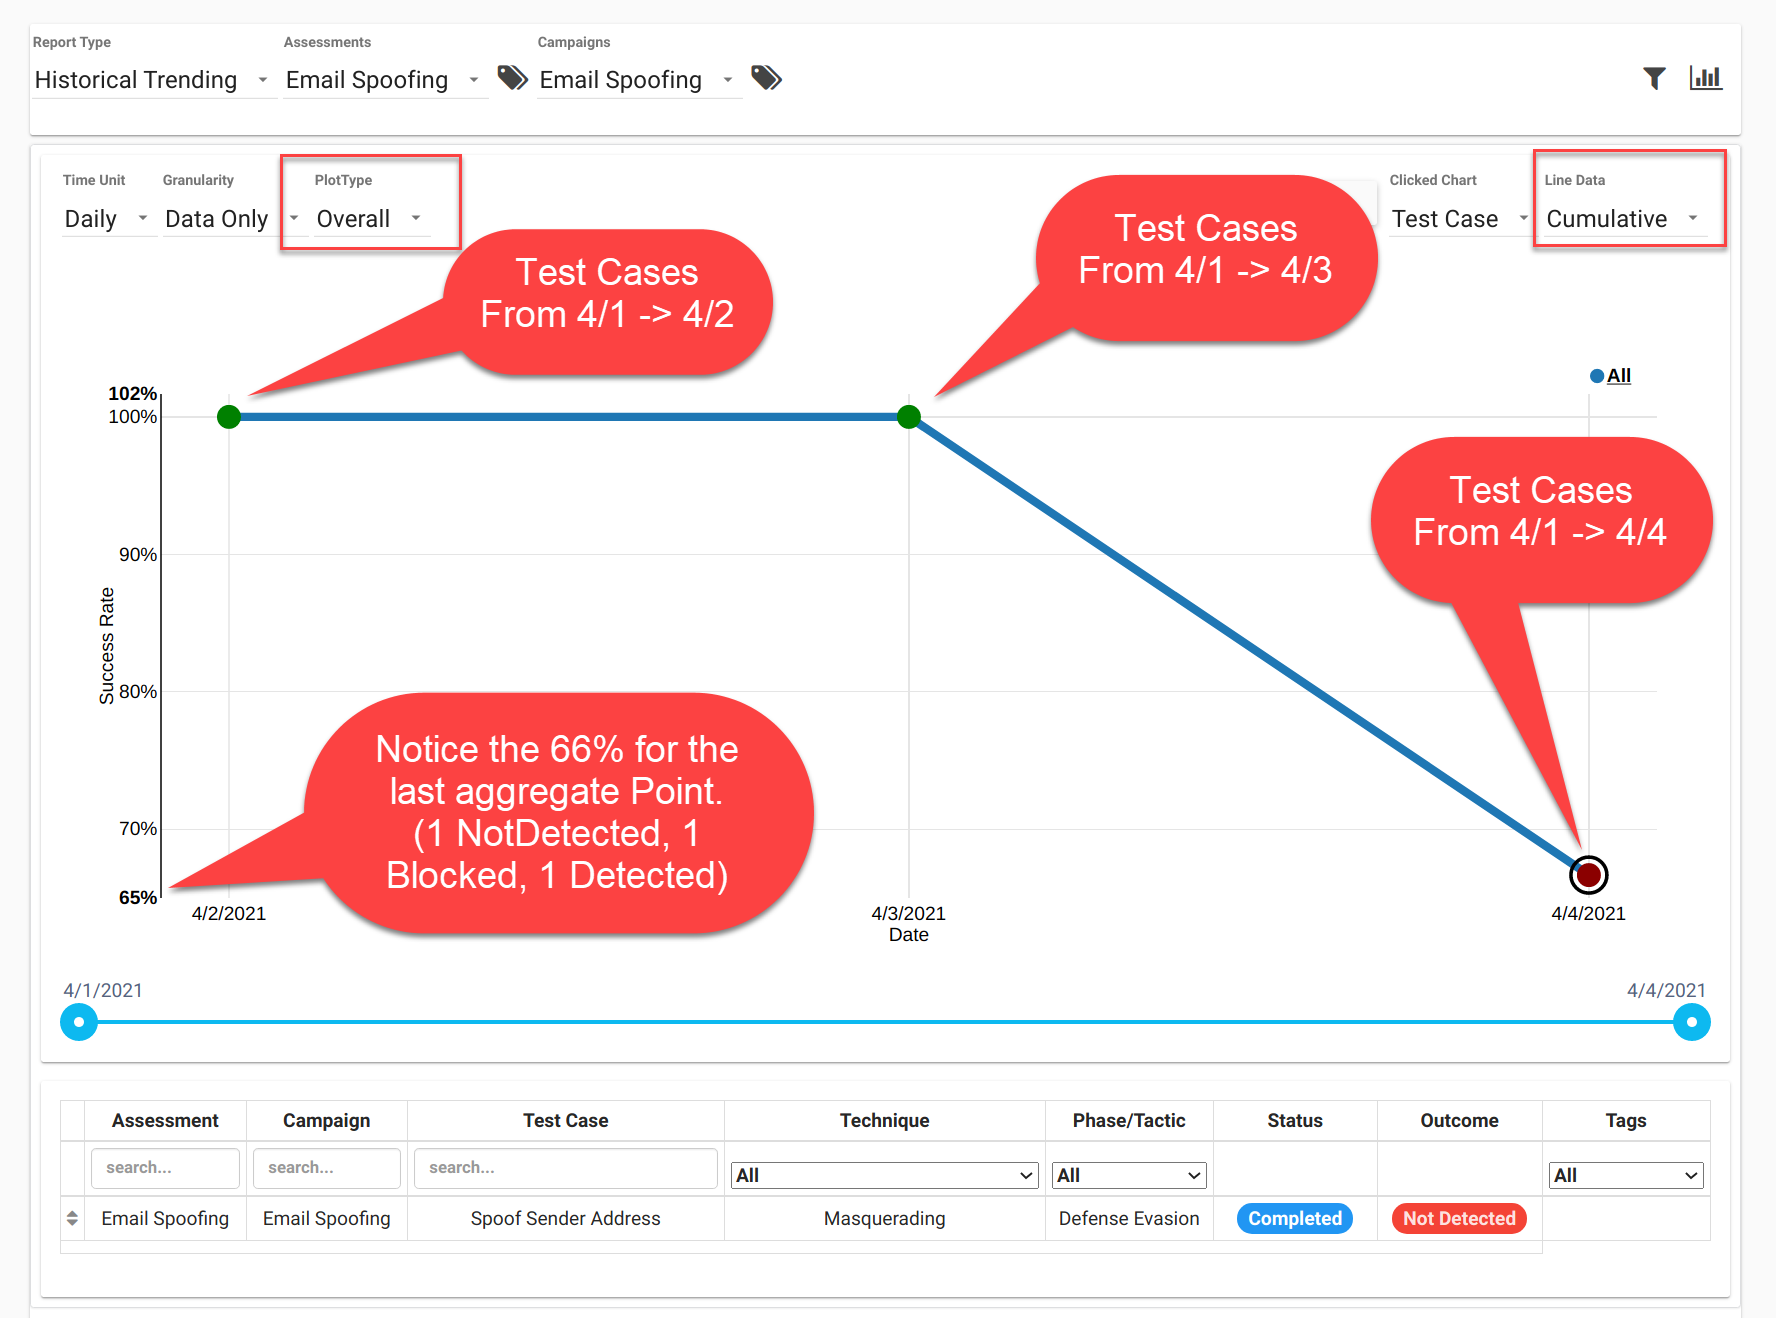
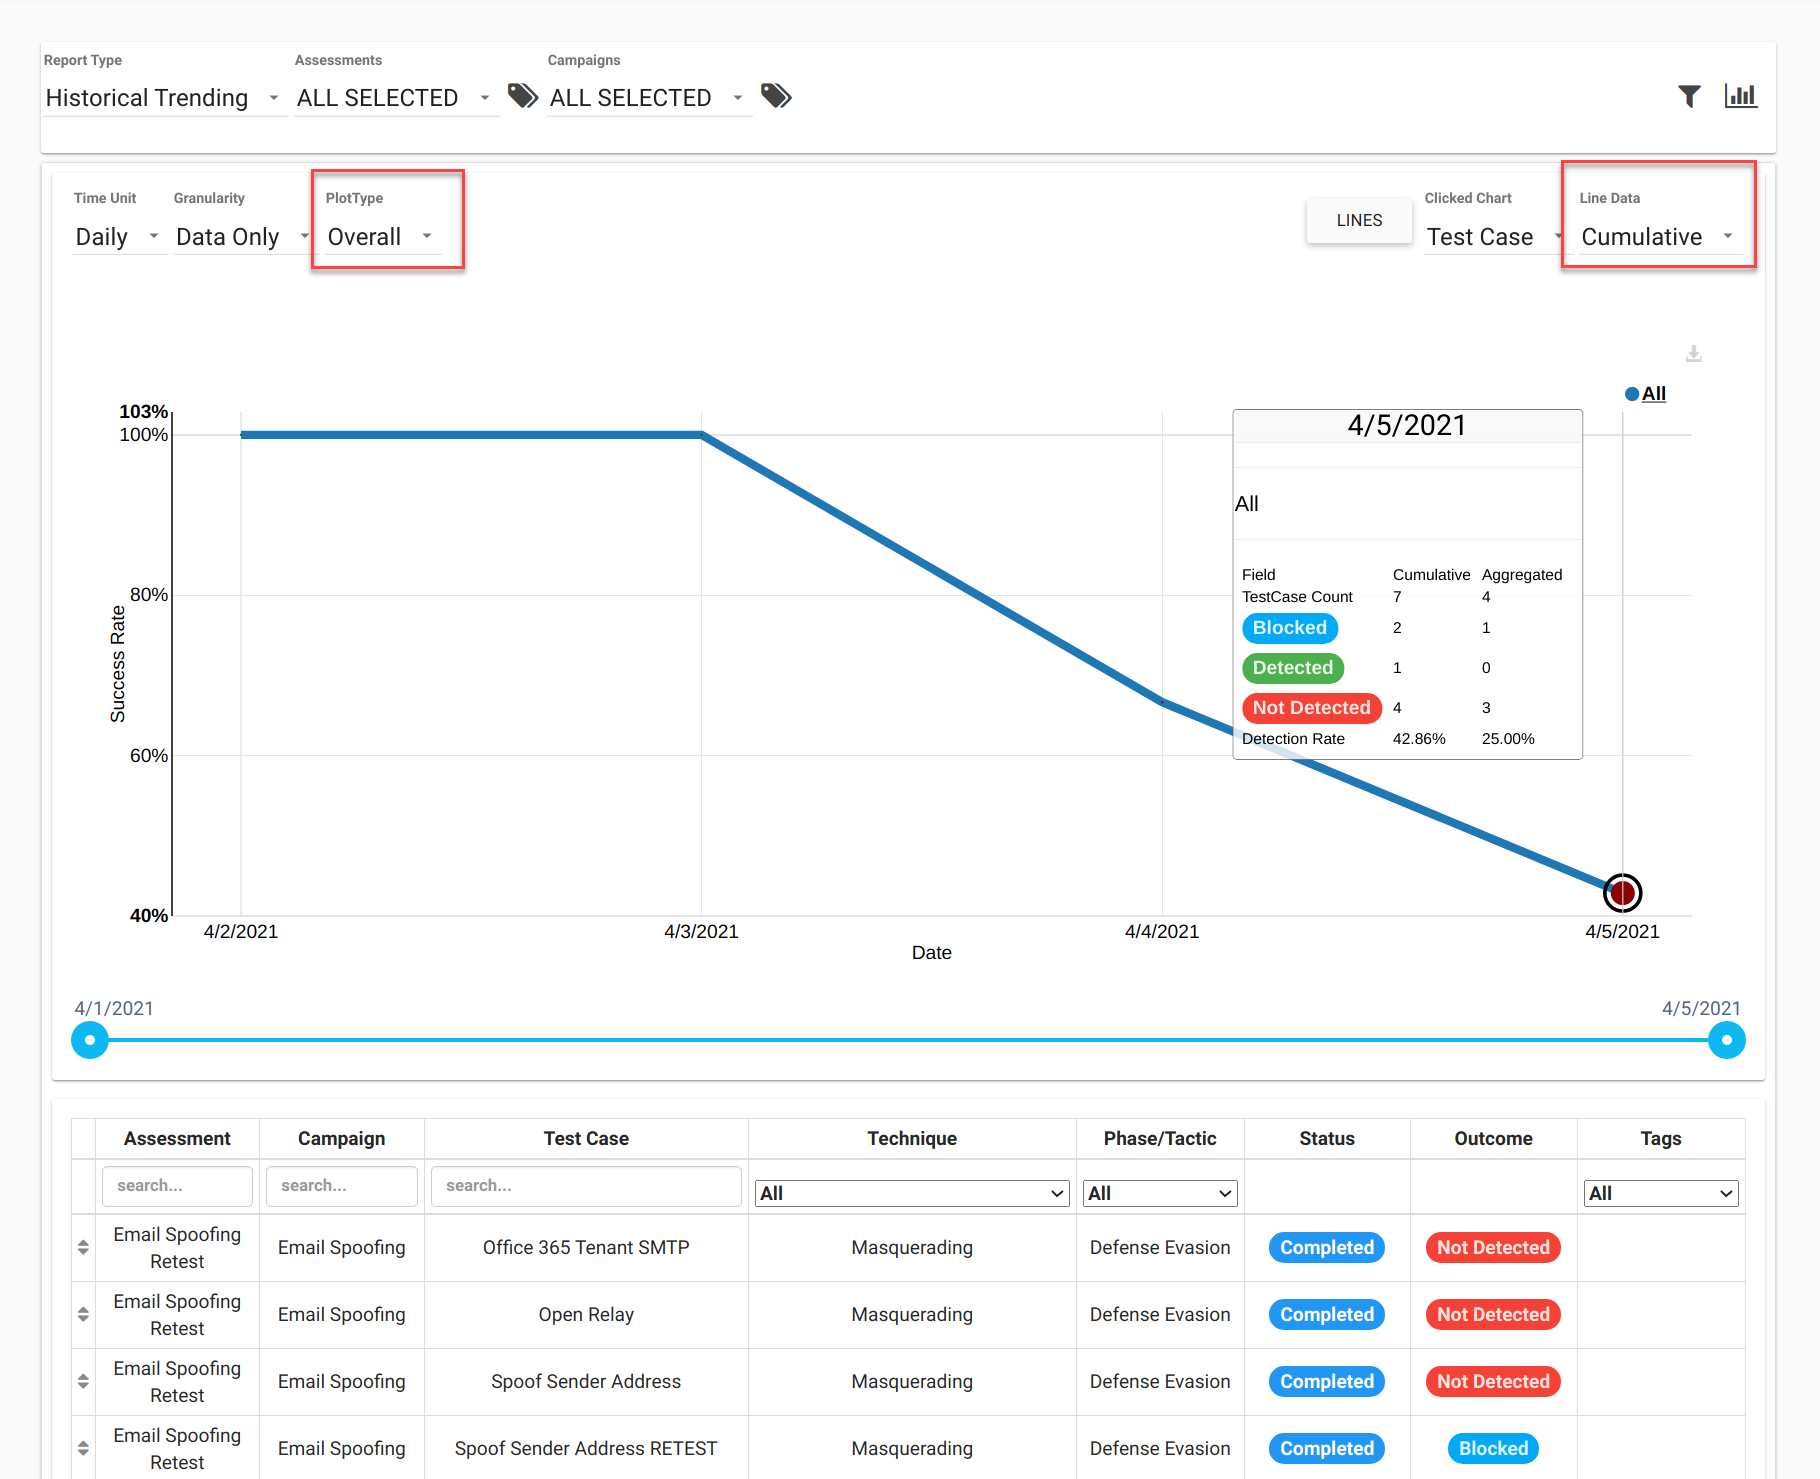
Cumulative
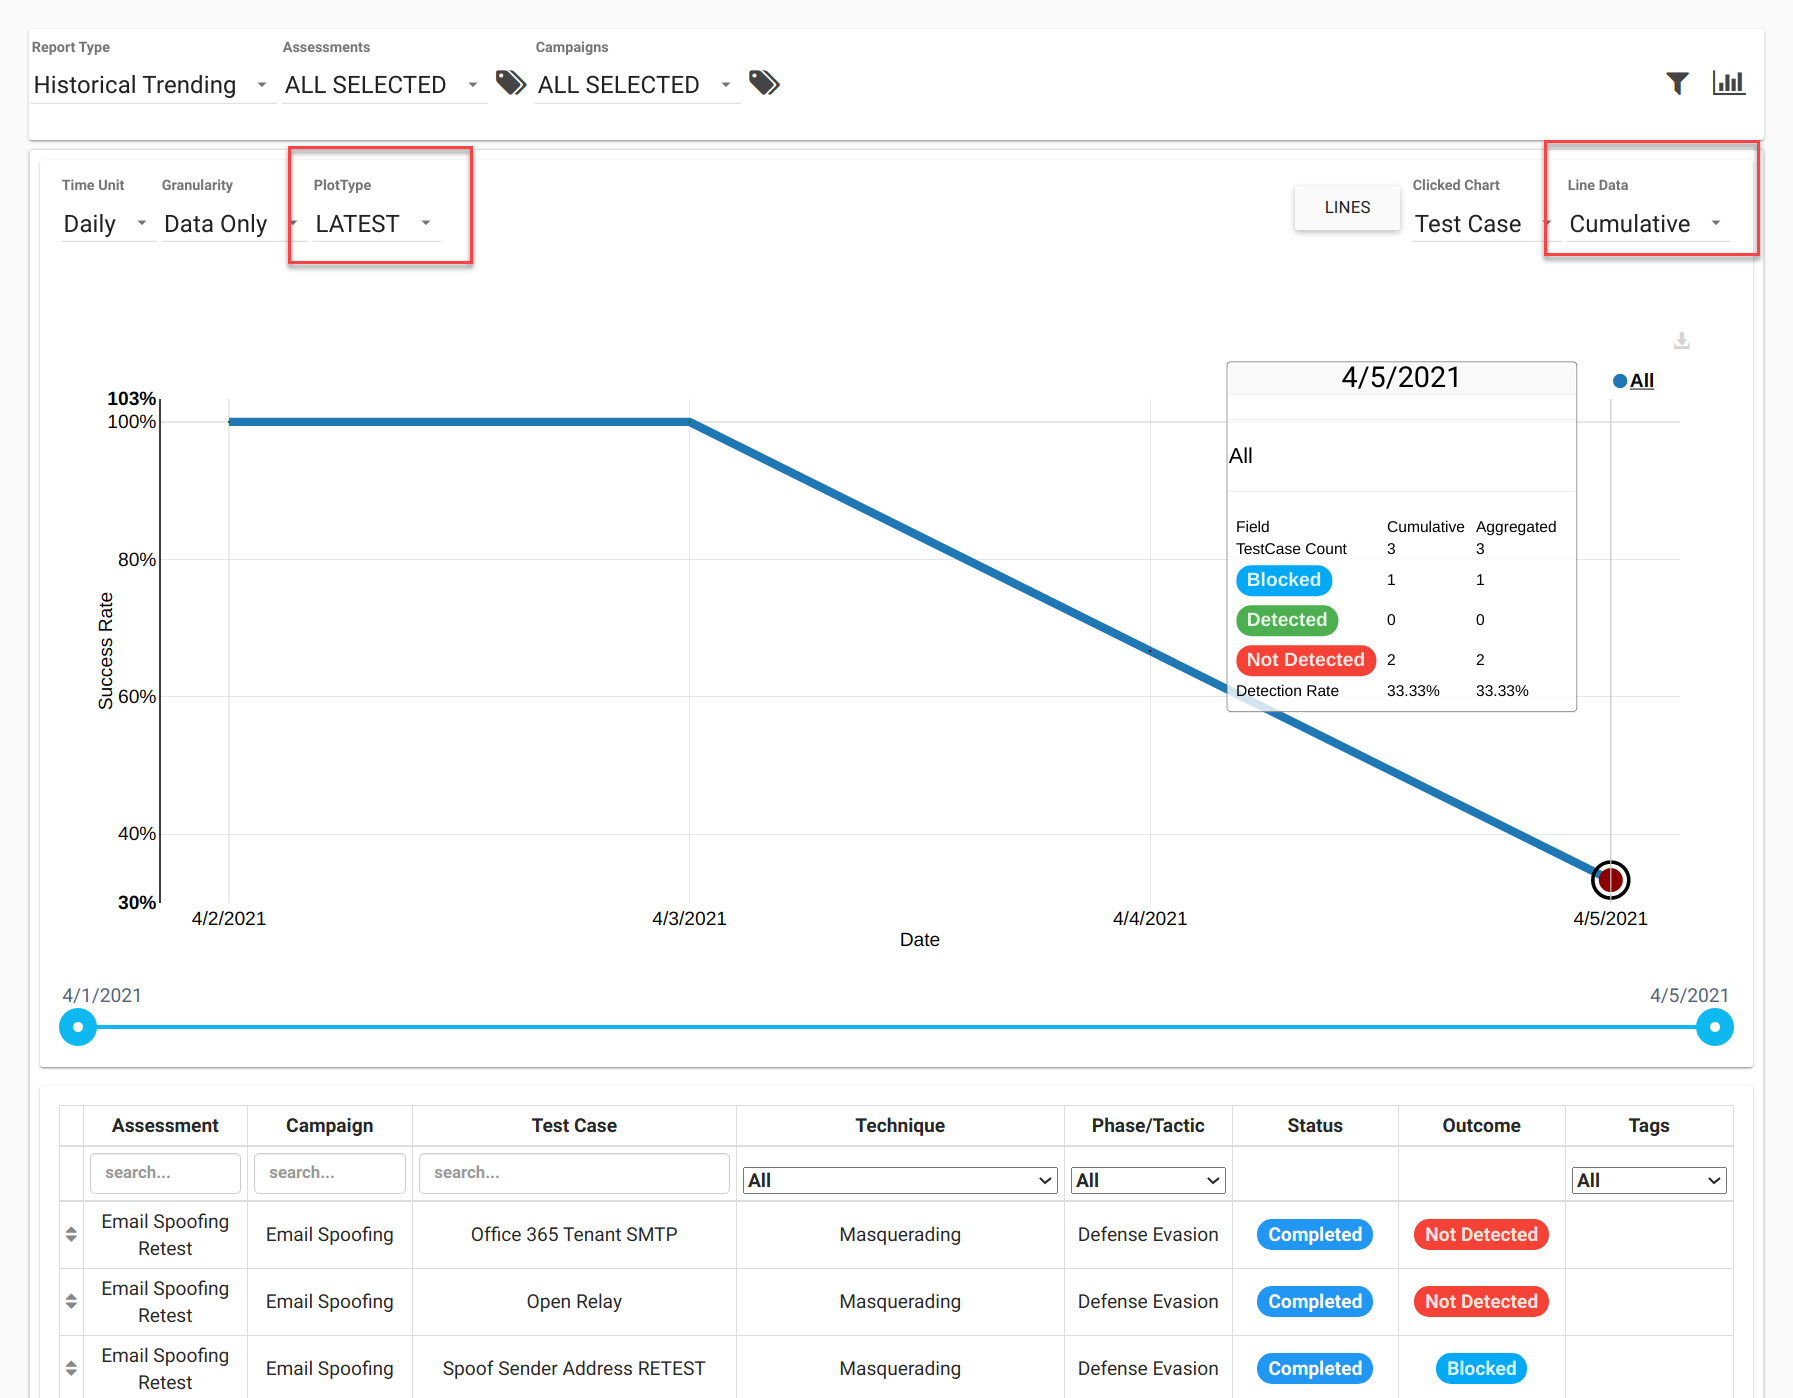
Cumulative Points calculate success rate based on all test cases from the first date to the date of the point.
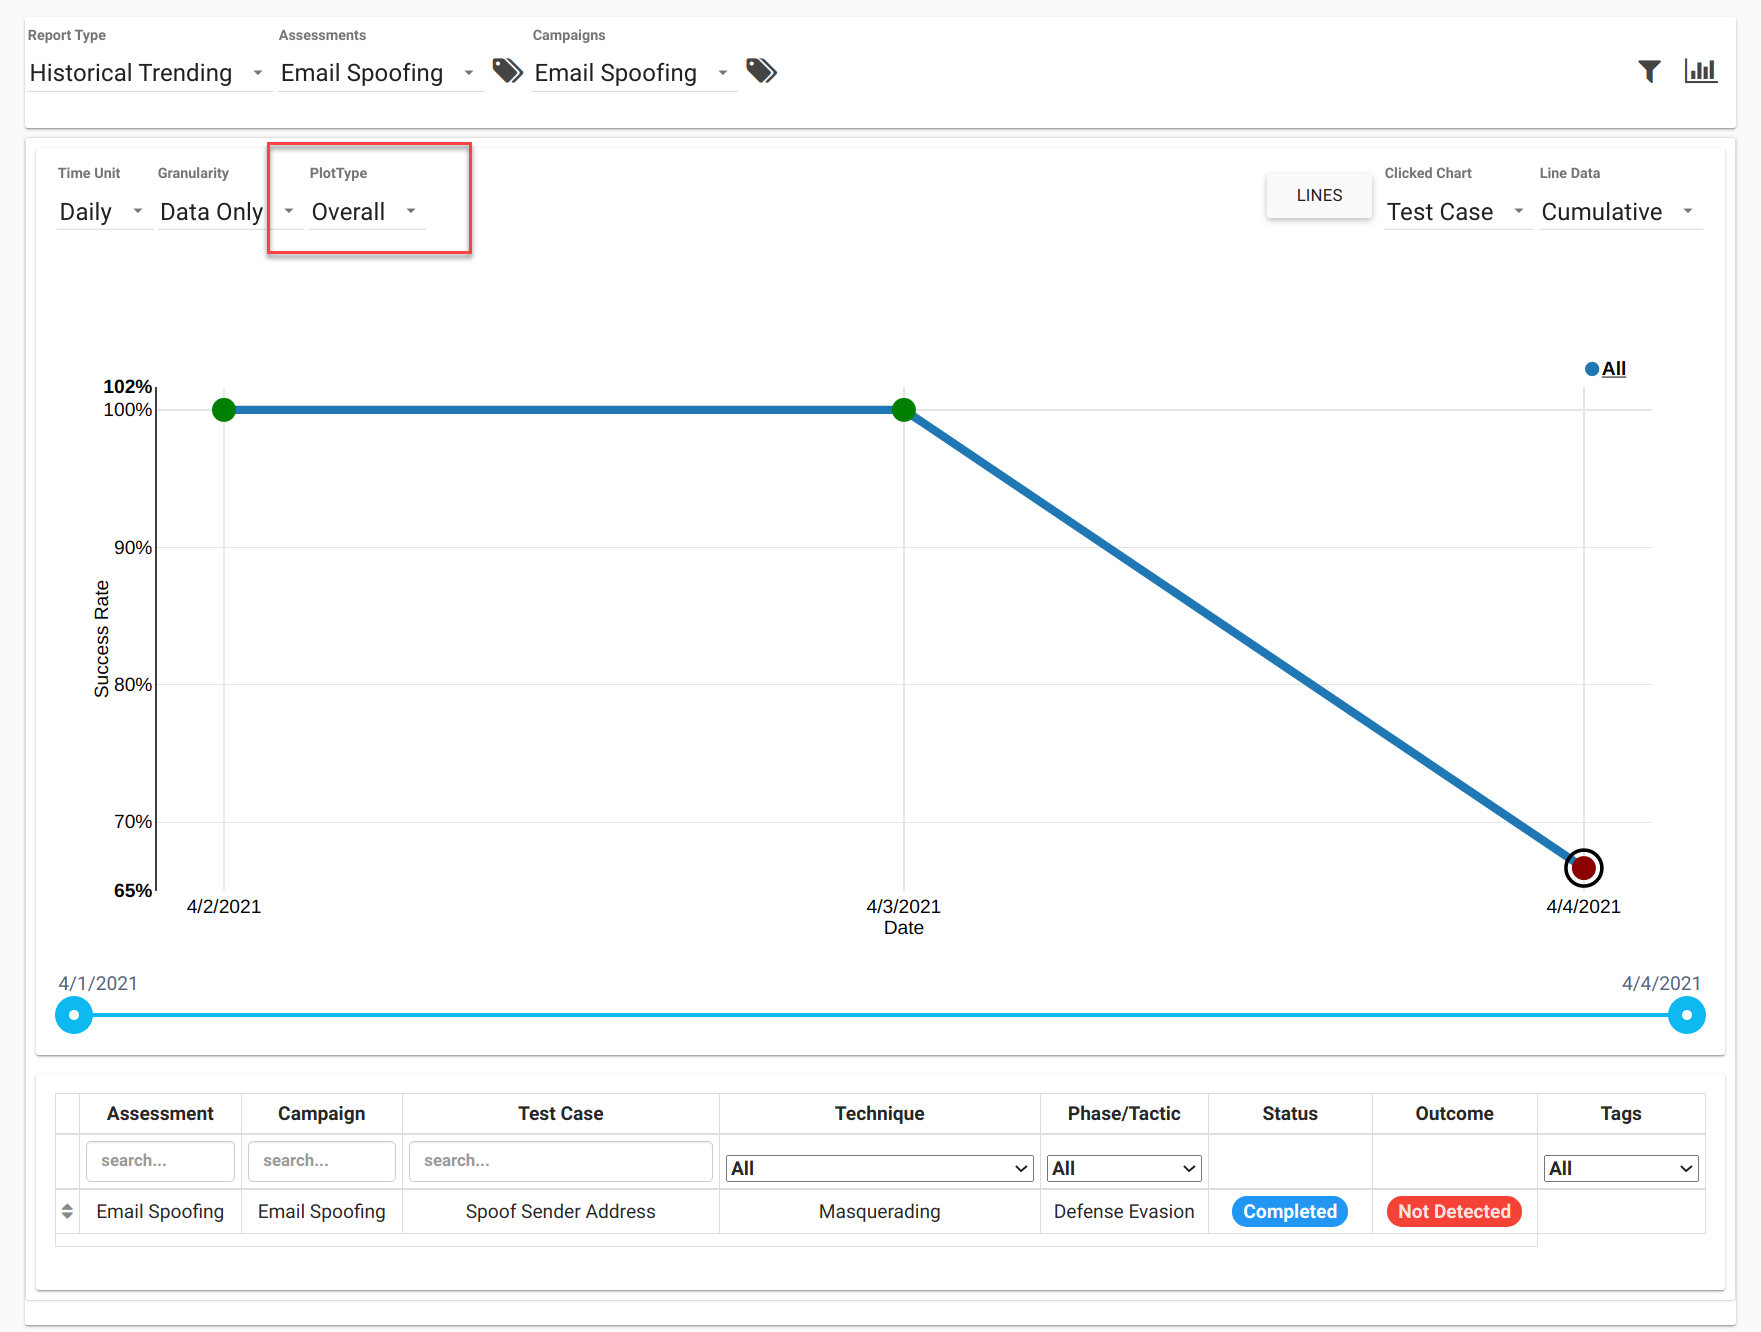
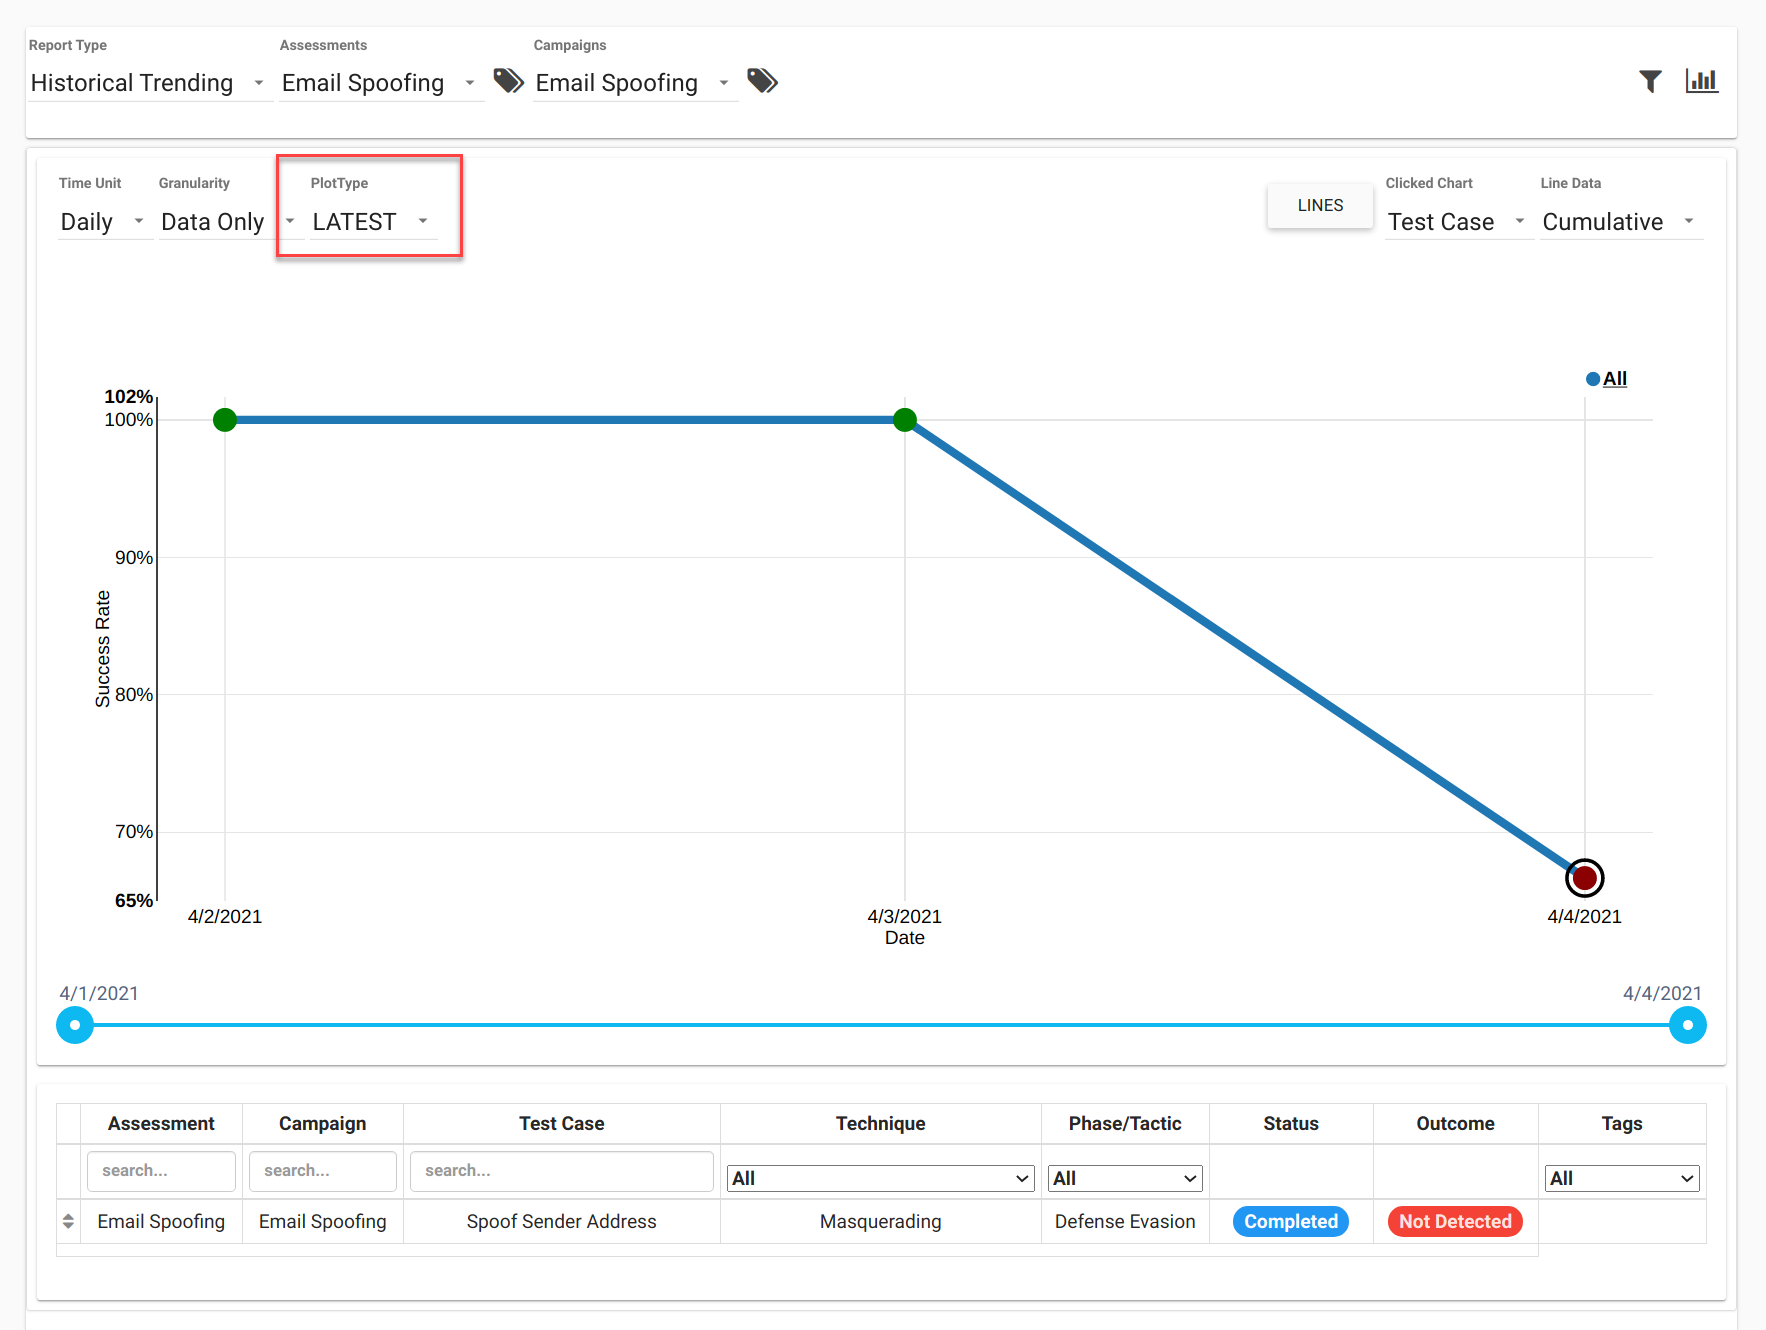
Overall vs Latest
Because all 3 Test Cases have different TemplateIDs, there is no difference between the Overall and Latest views
Overall
Latest
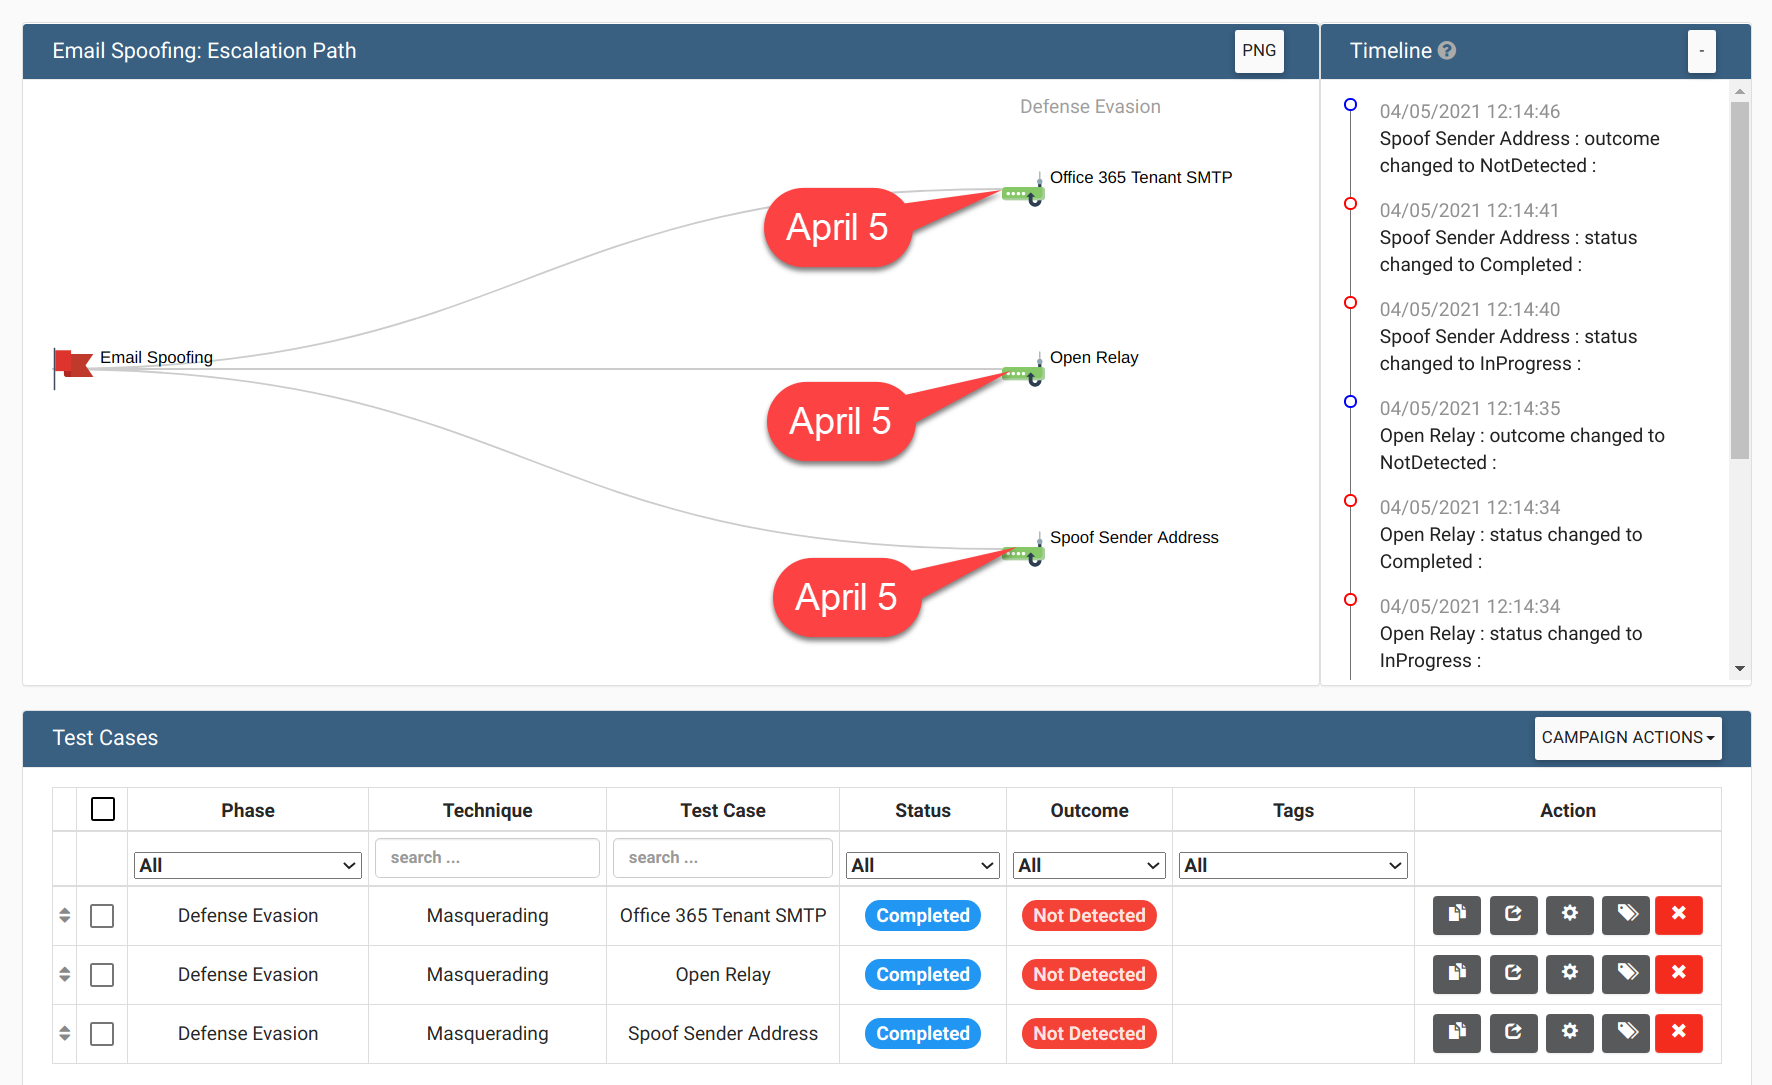
Campaign Retest
Let’s do a RETEST of all 3 Test Cases on April 5th. This time, all 3 are Not Detected.
Reminder
Here is the current state of the assessment
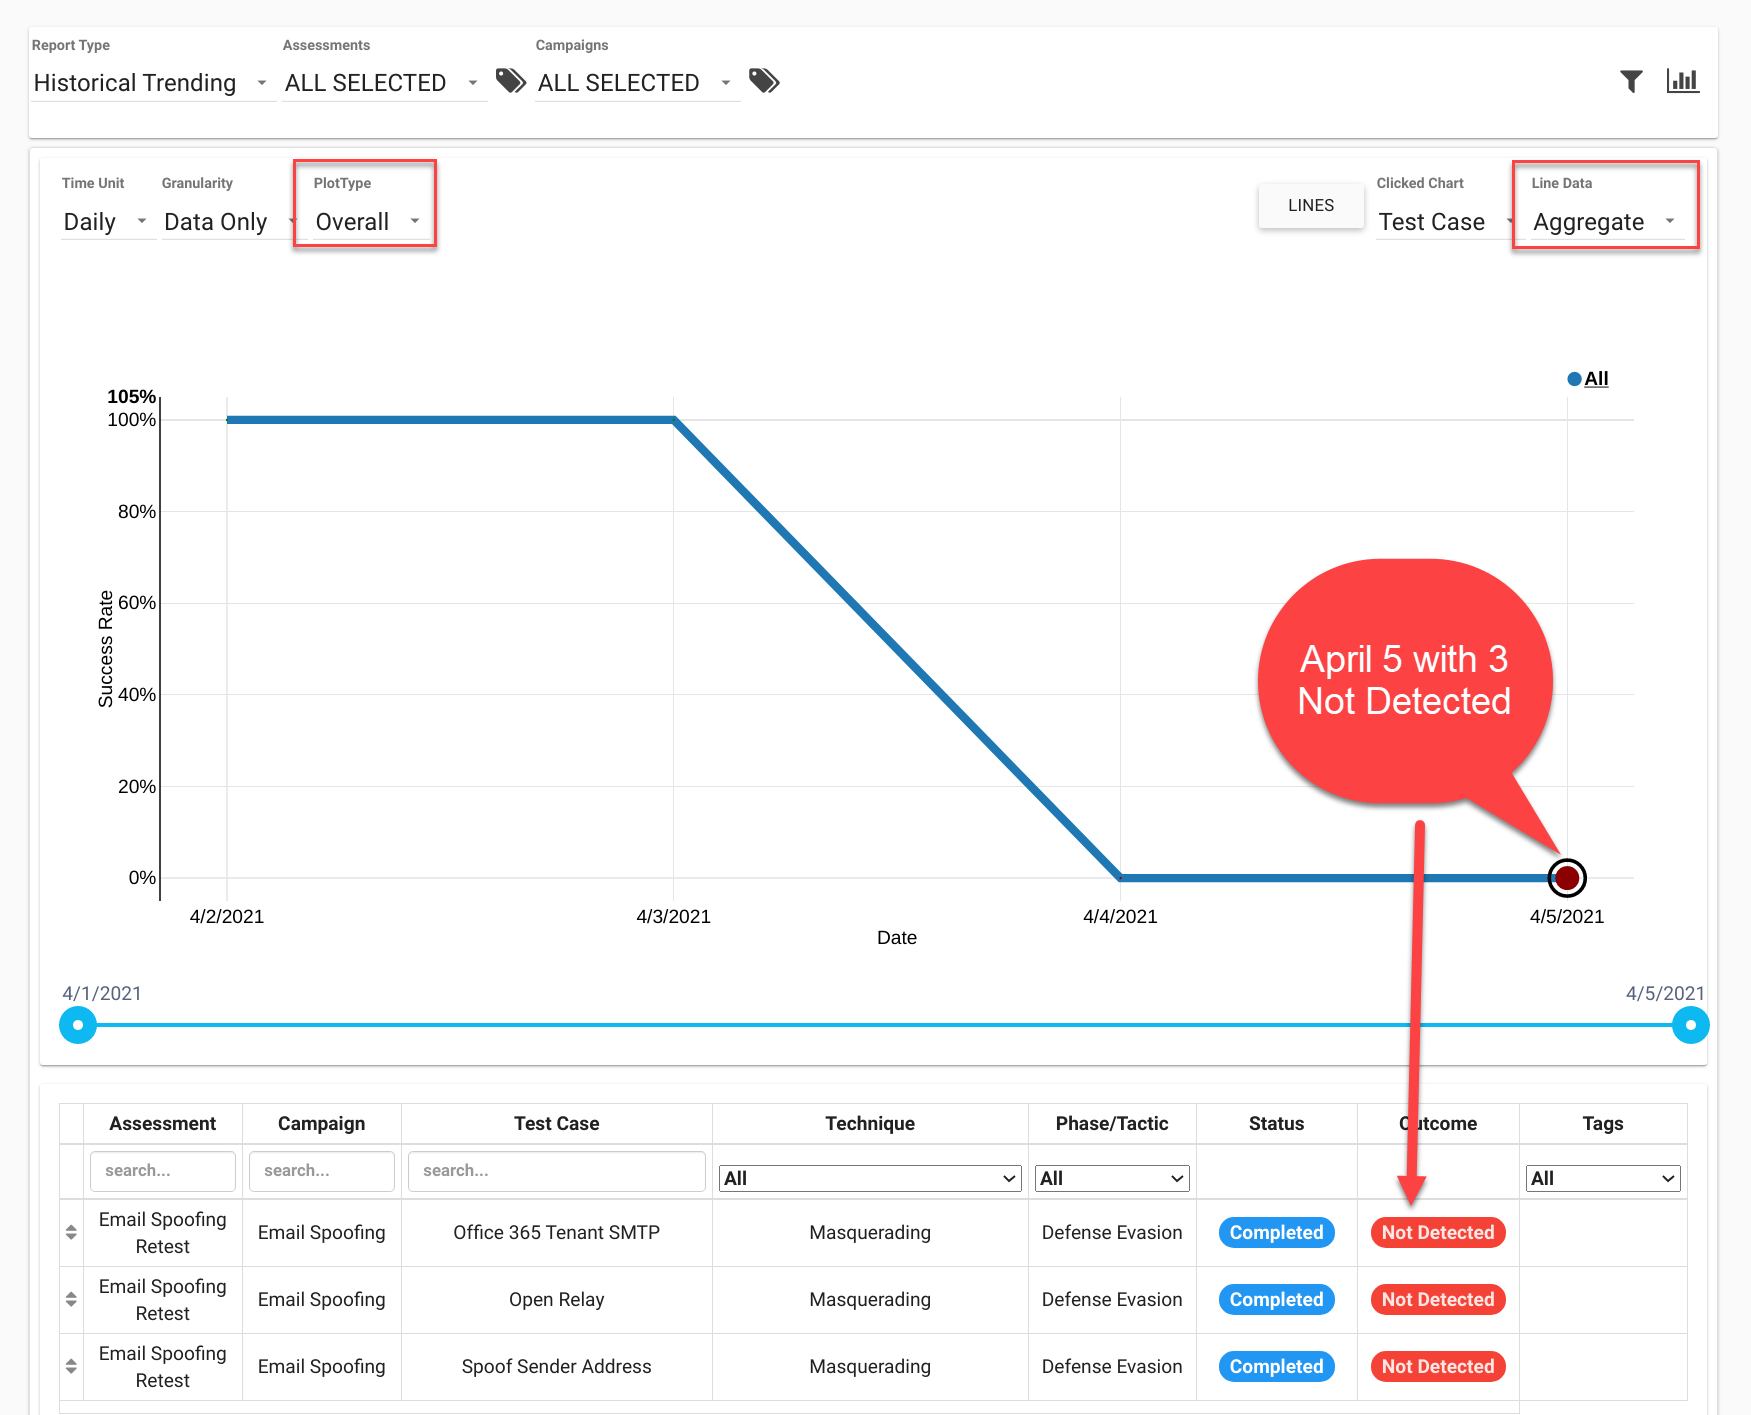
Overall Aggregate
Shows the additional point of April 5th
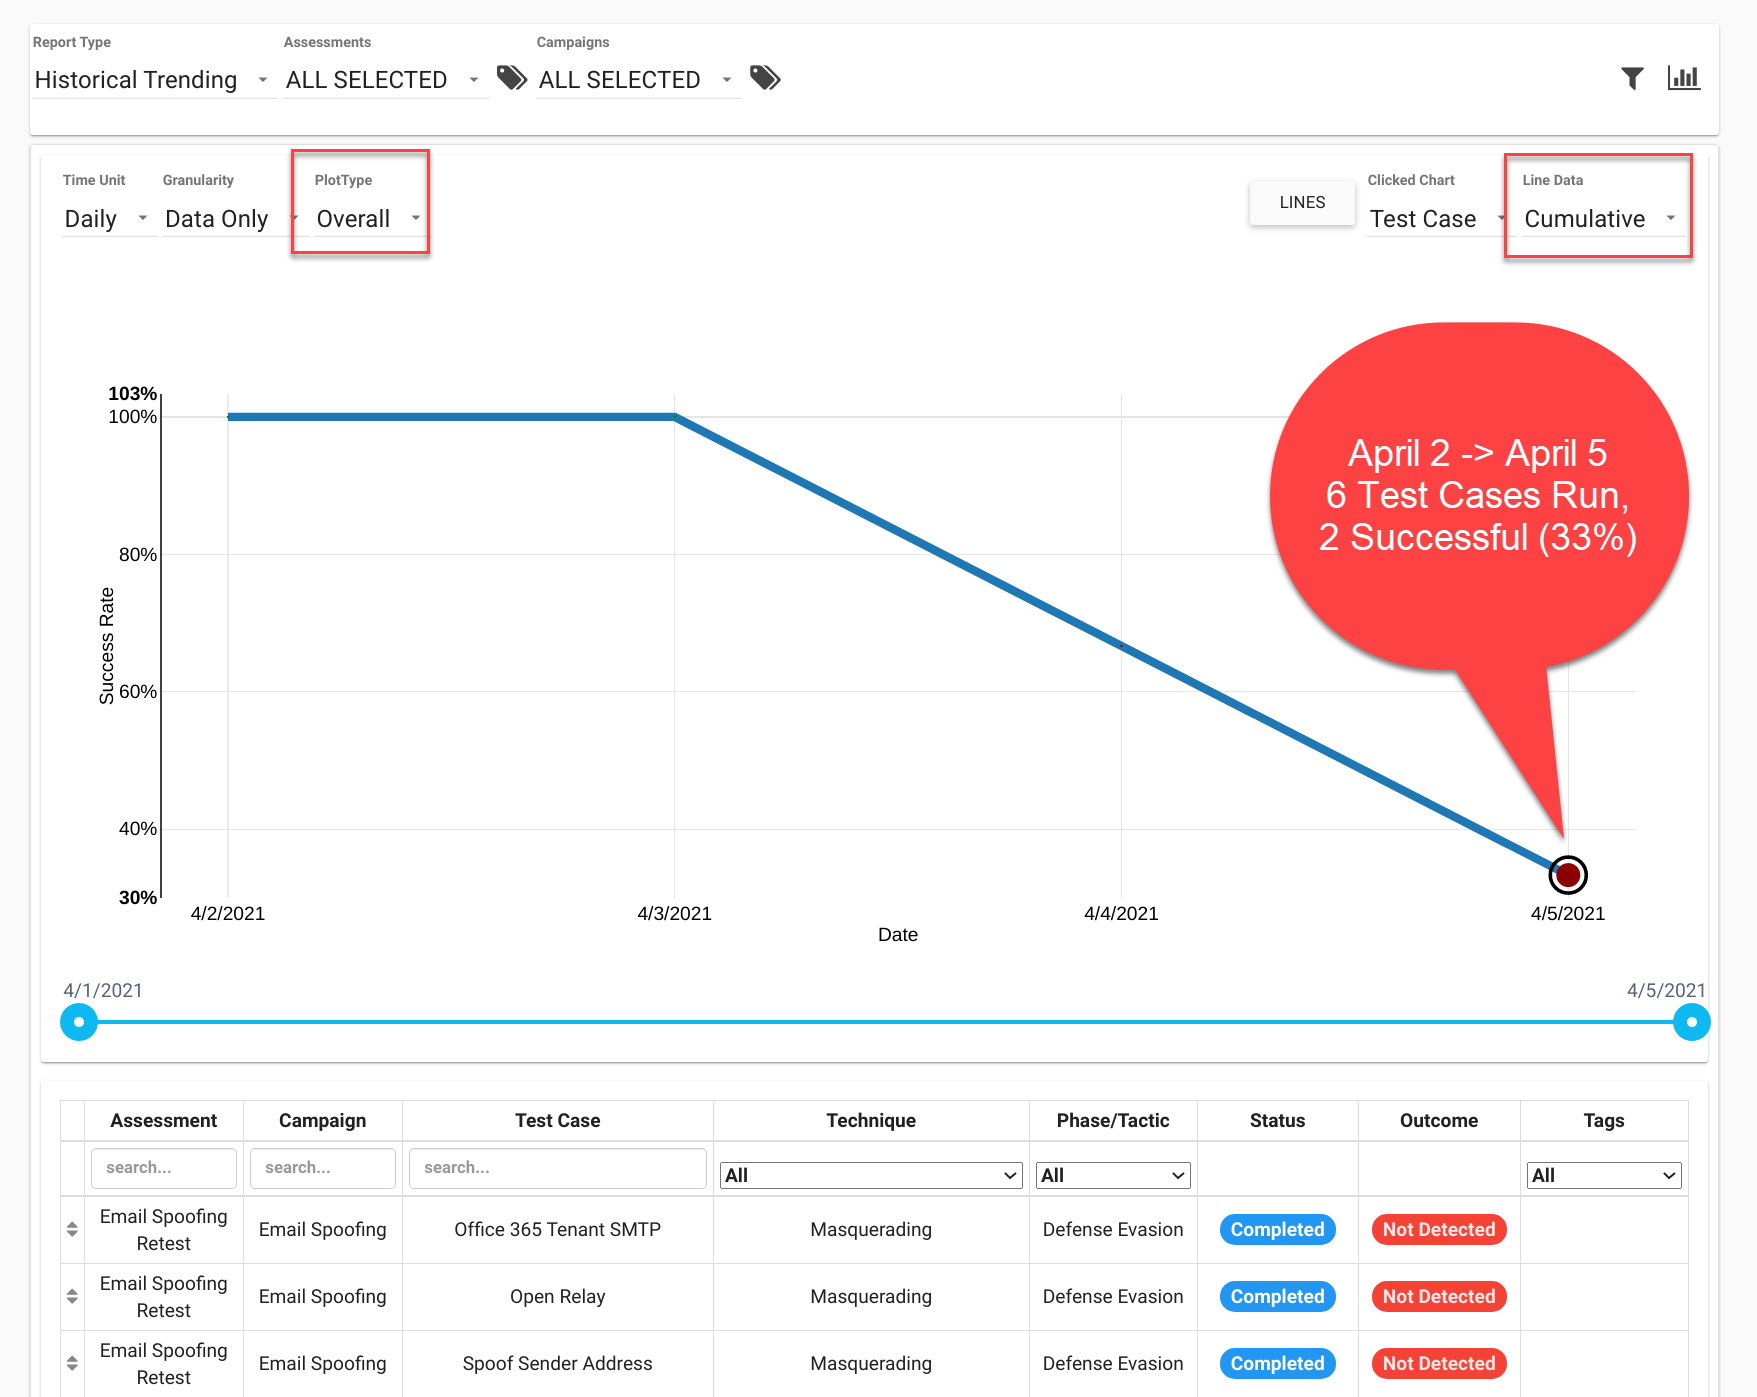
Overall Cumulative
Shows the additional point of April 5th. Success rate: 33% (2 Successful / 6 total tests…2/6)
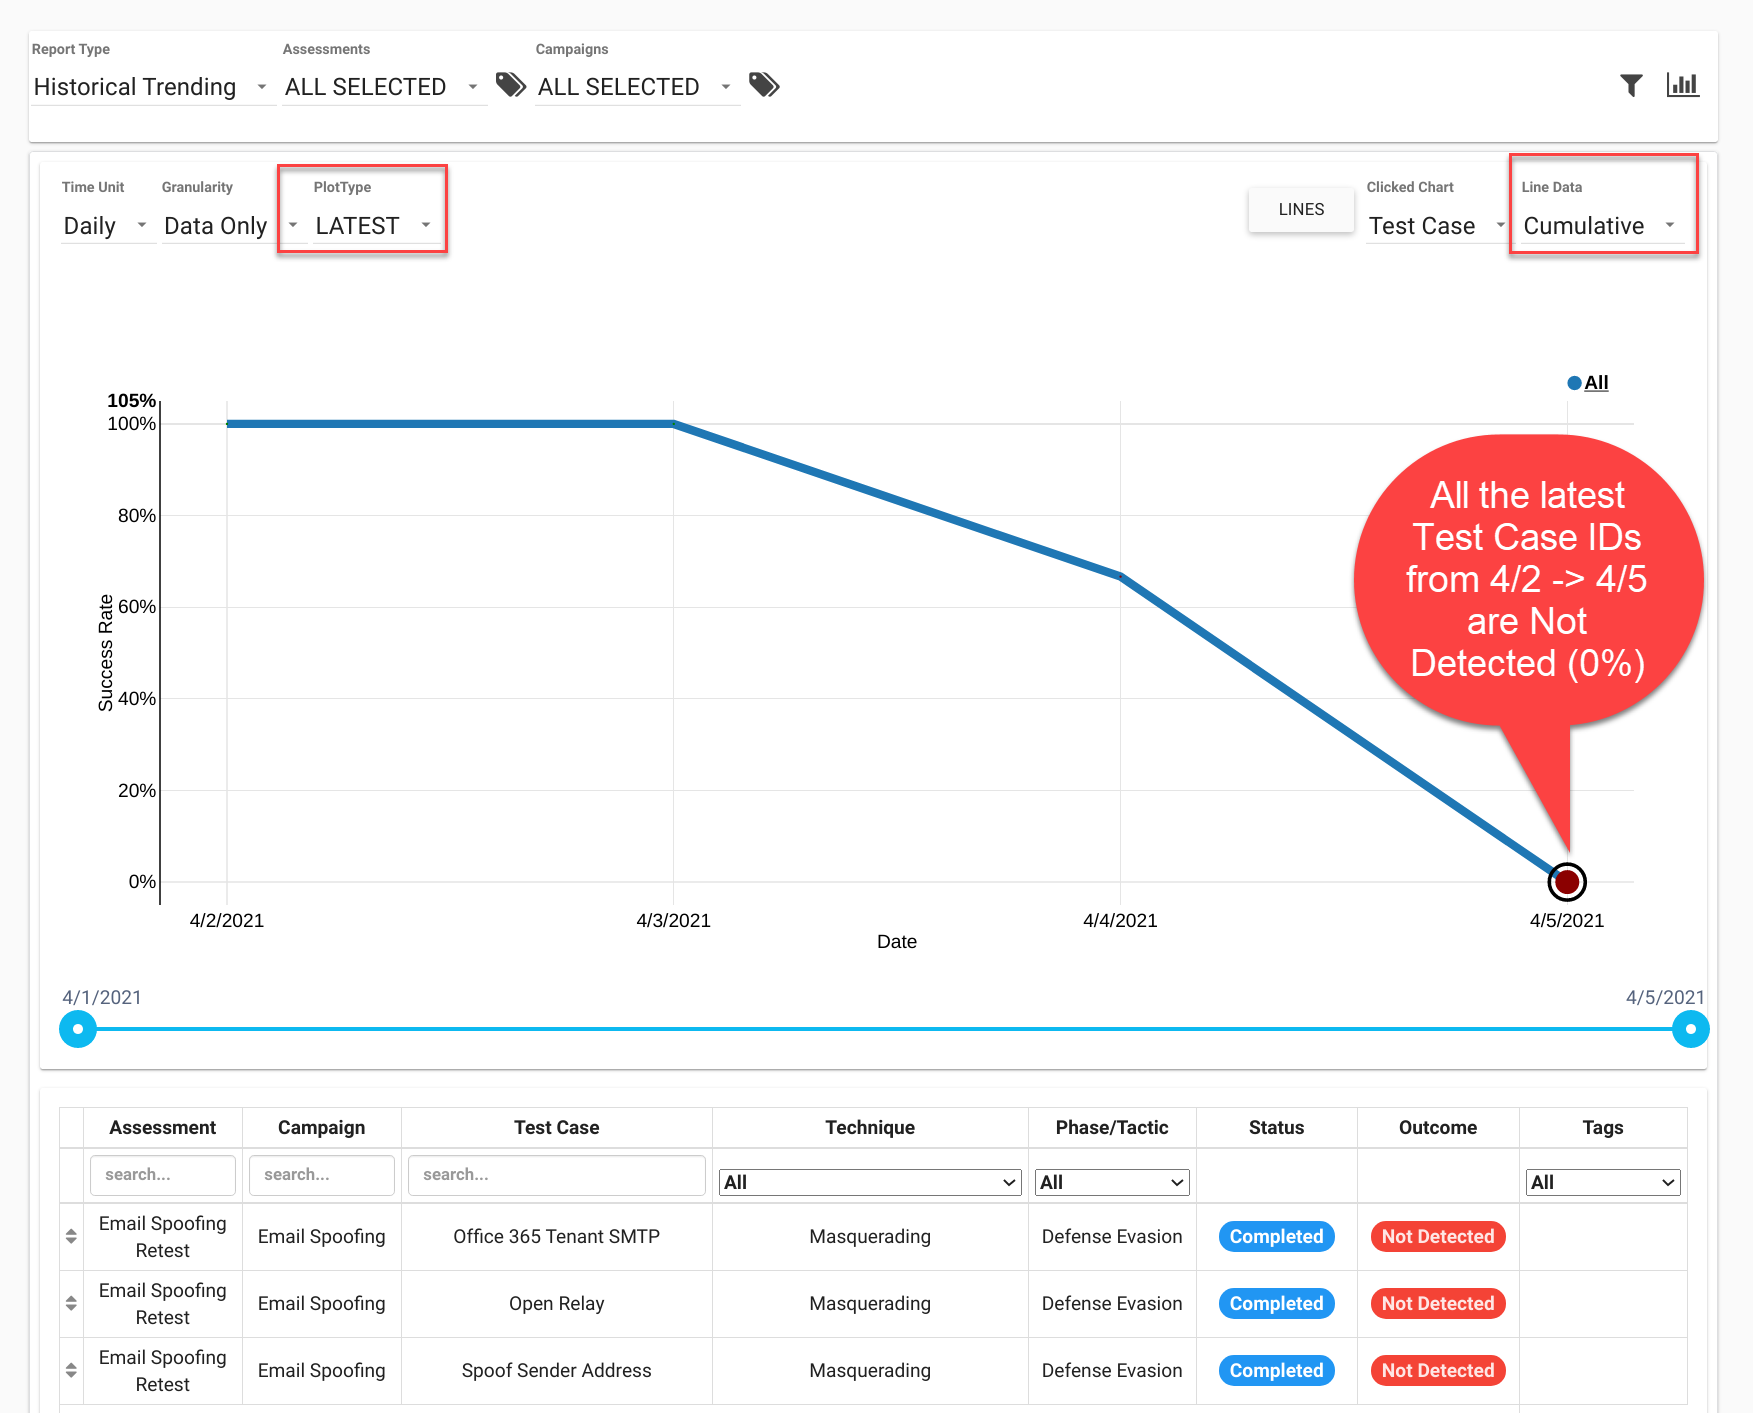
Latest Cumulative
Shows the additional point of April 5th
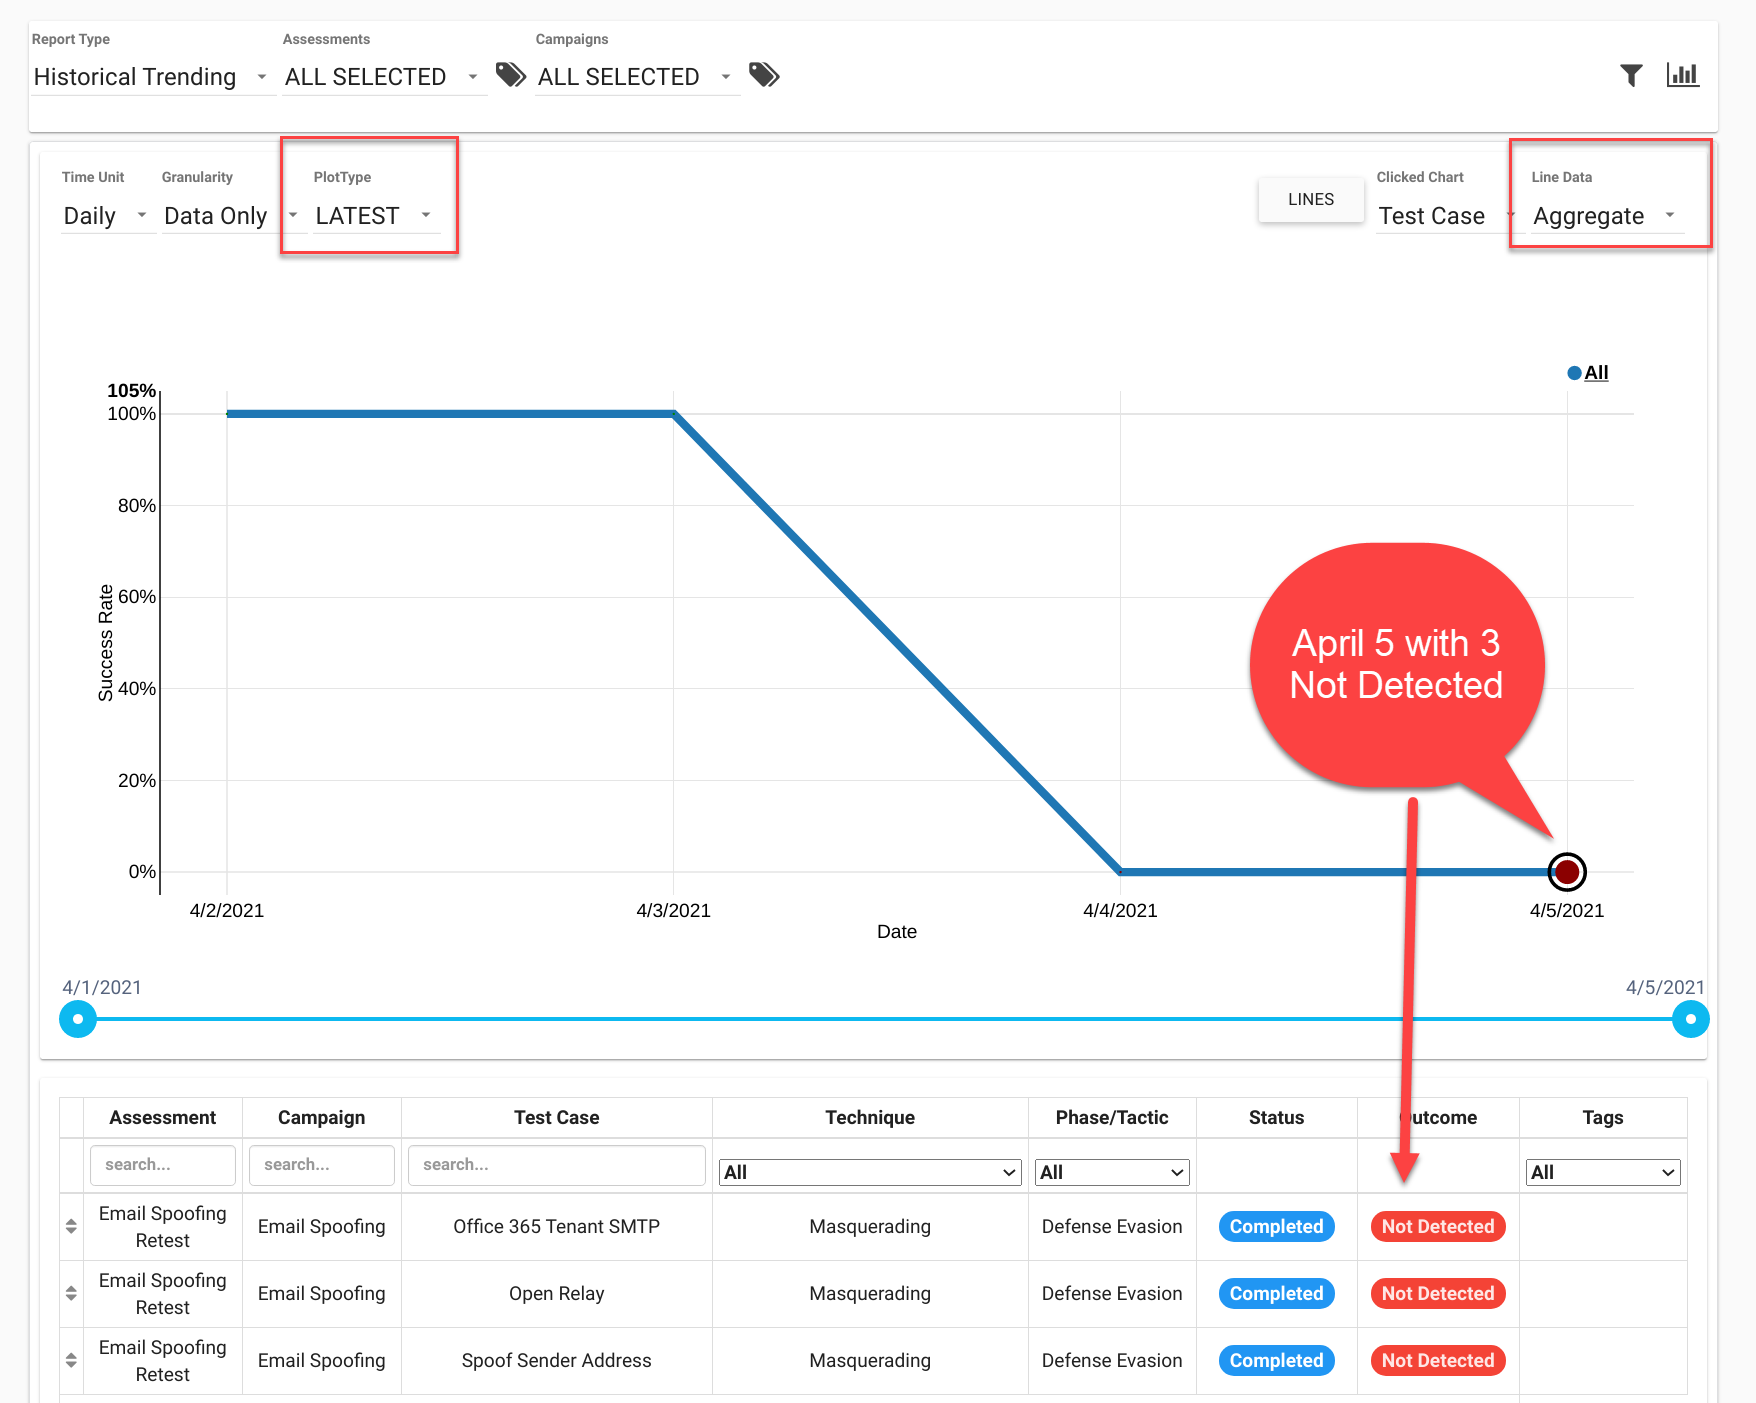
Latest Aggregate
Shows the additional point of April 5th
Test Case Retest
Let’s do a RETEST of JUST ONE Test Case on April 5th. The Retest performed later in the day (LATEST)
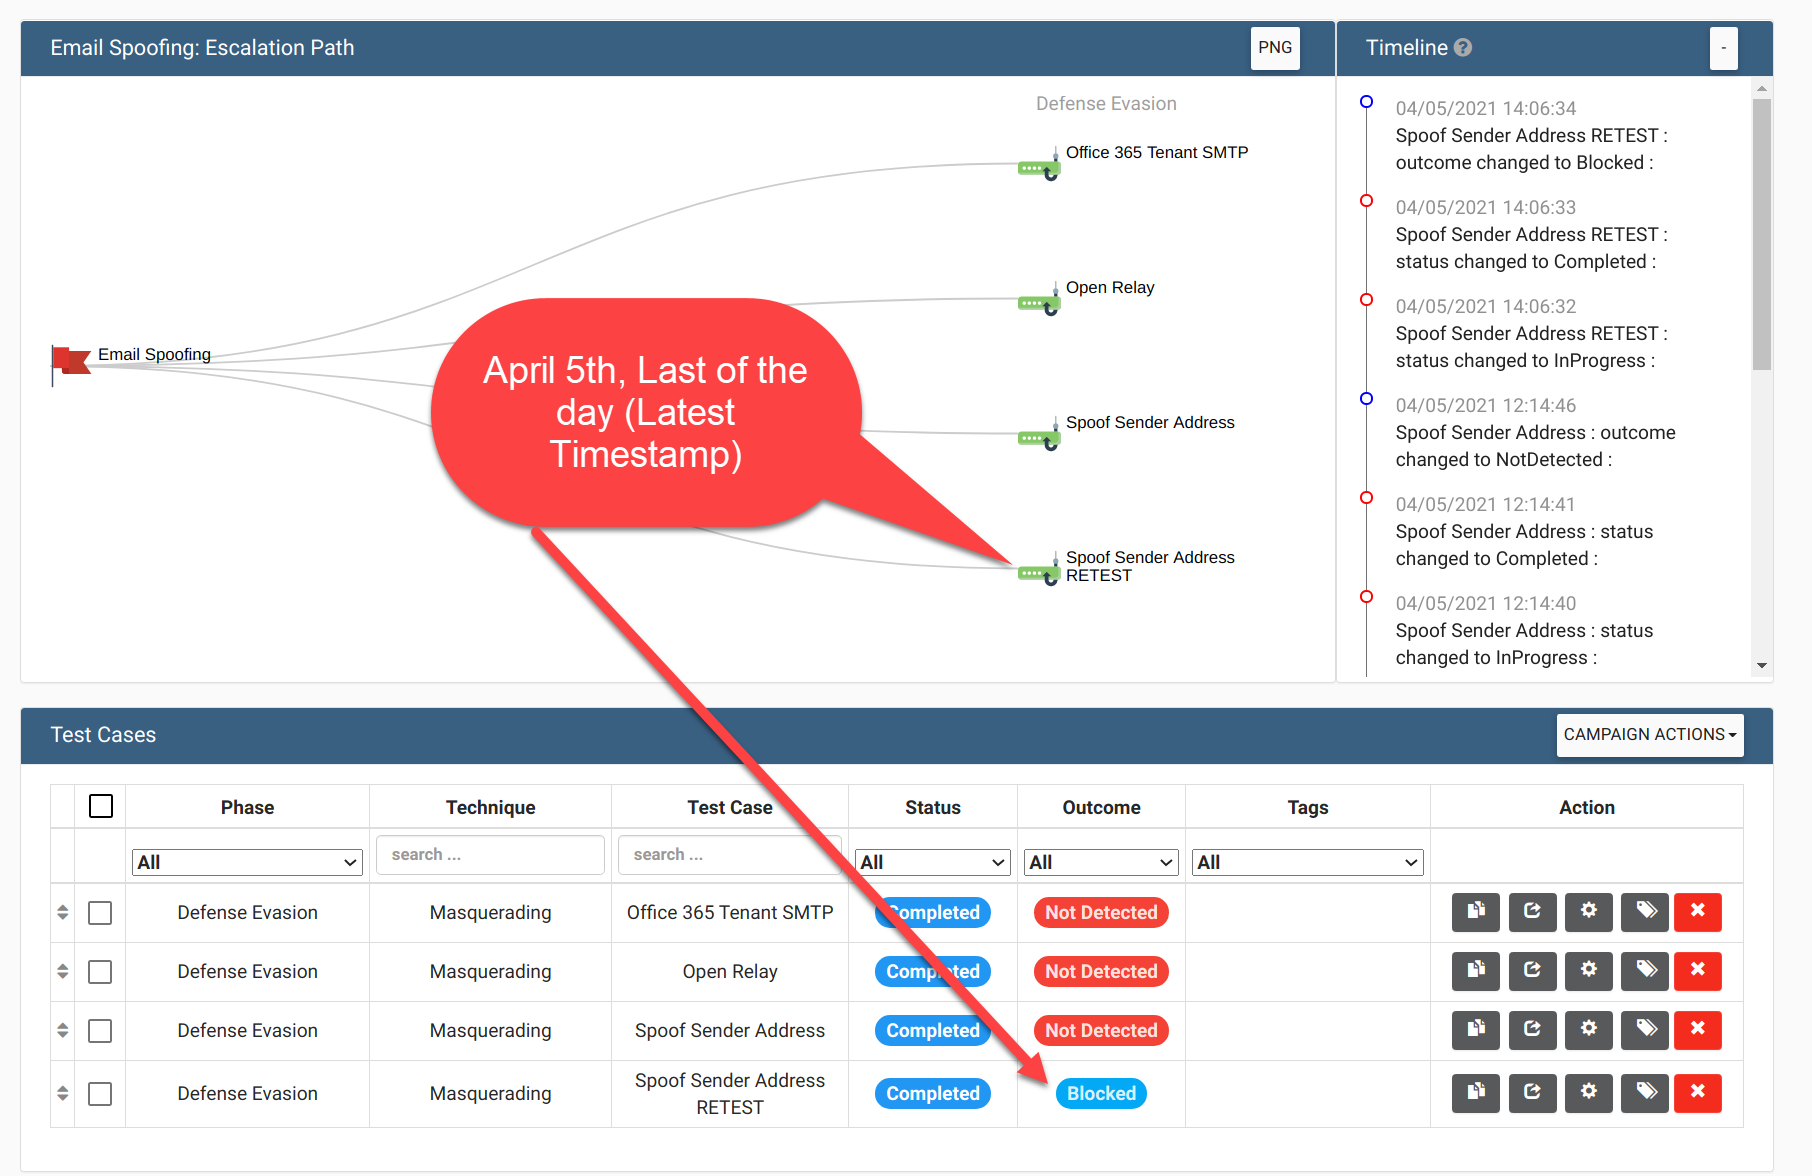
Reminder
Here is the current state of the assessment
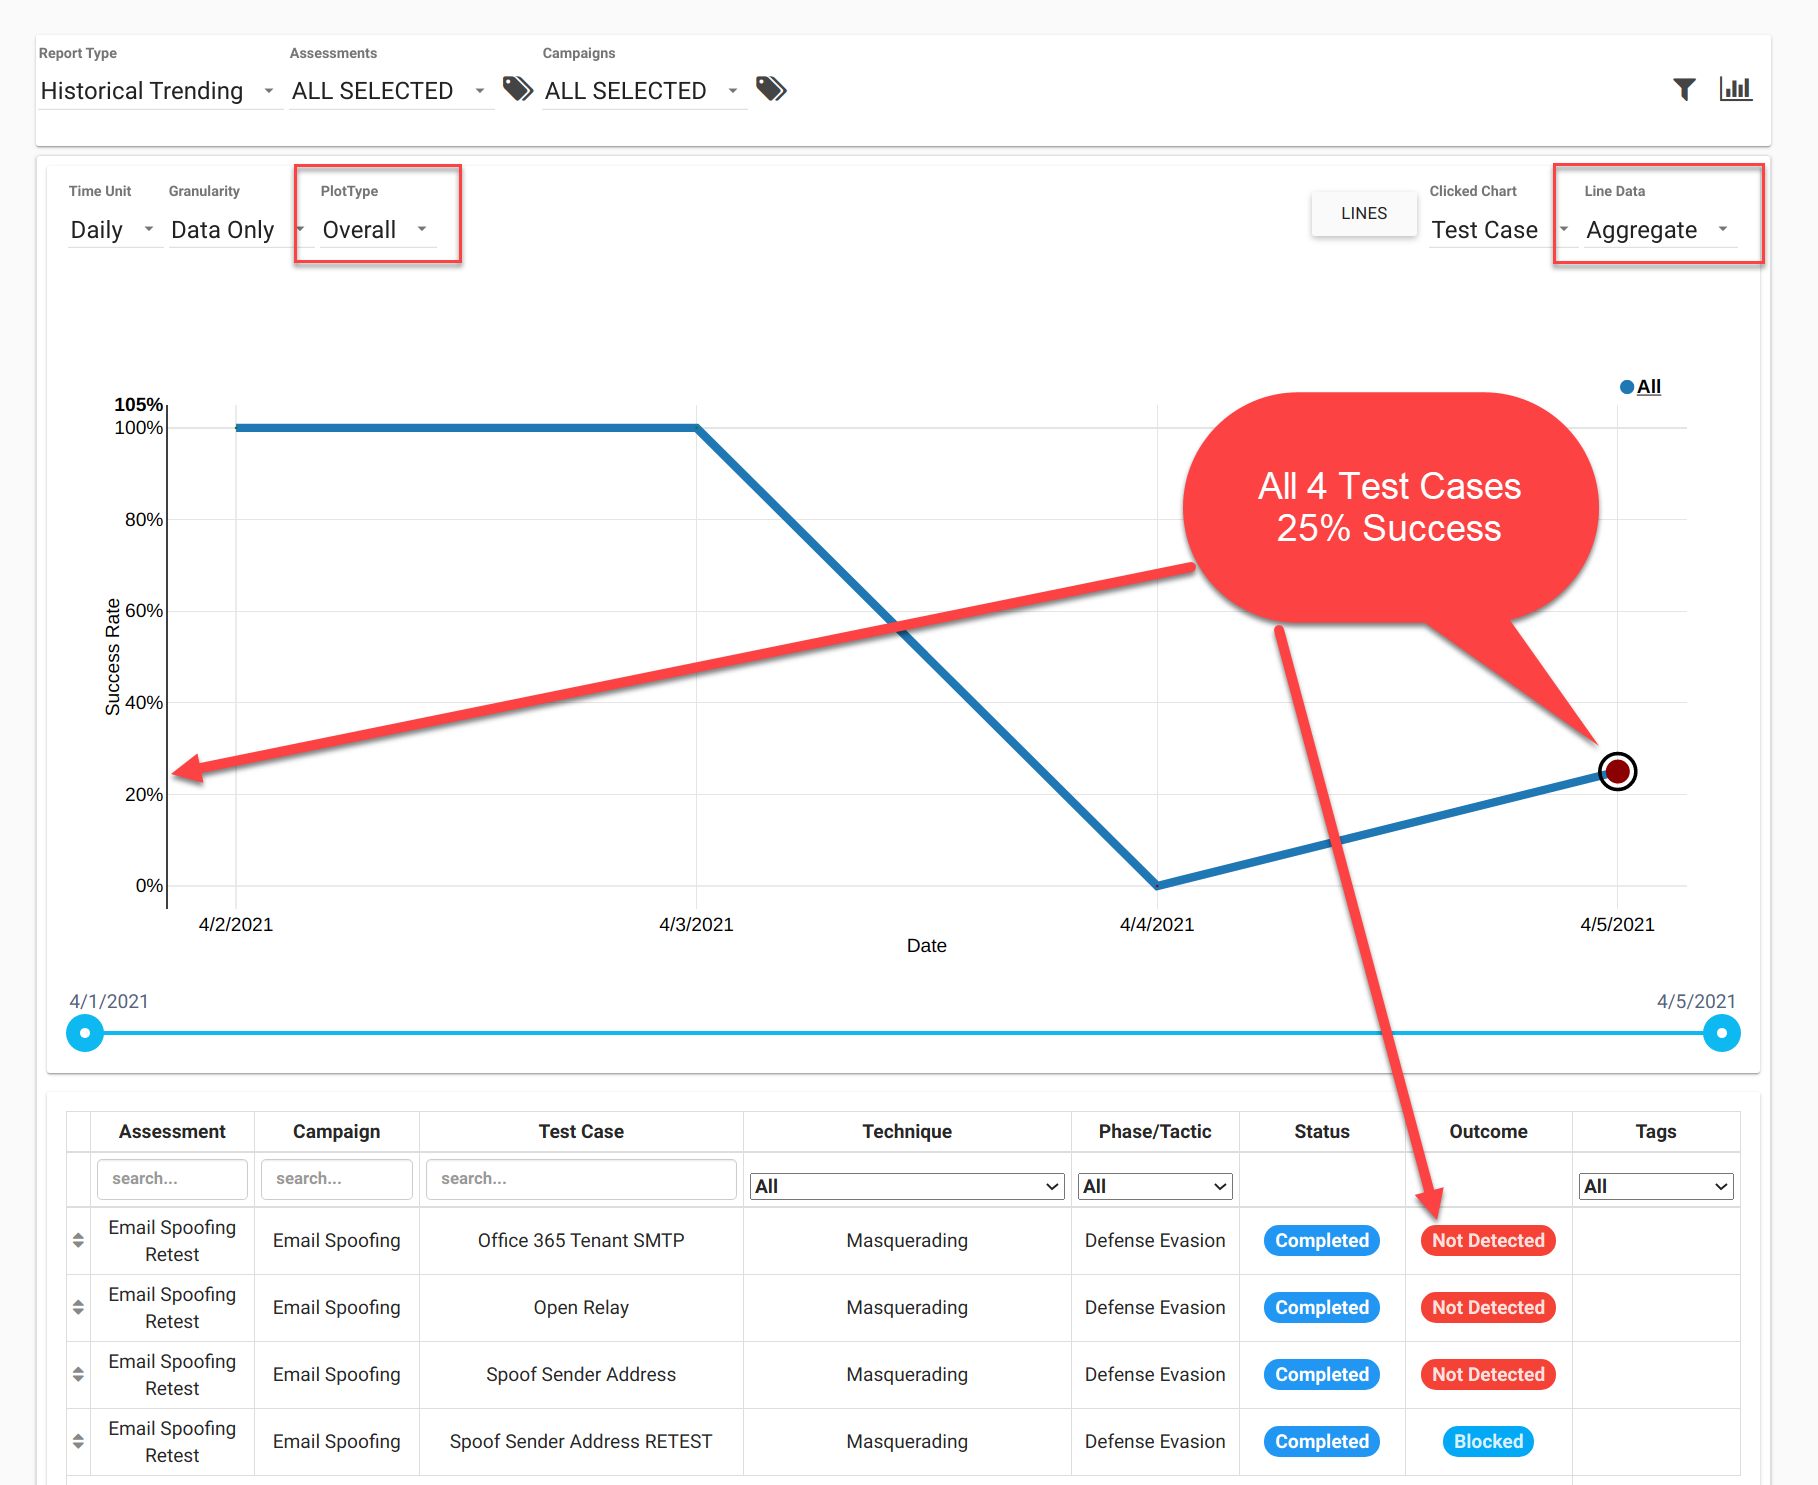
Overall Aggregate
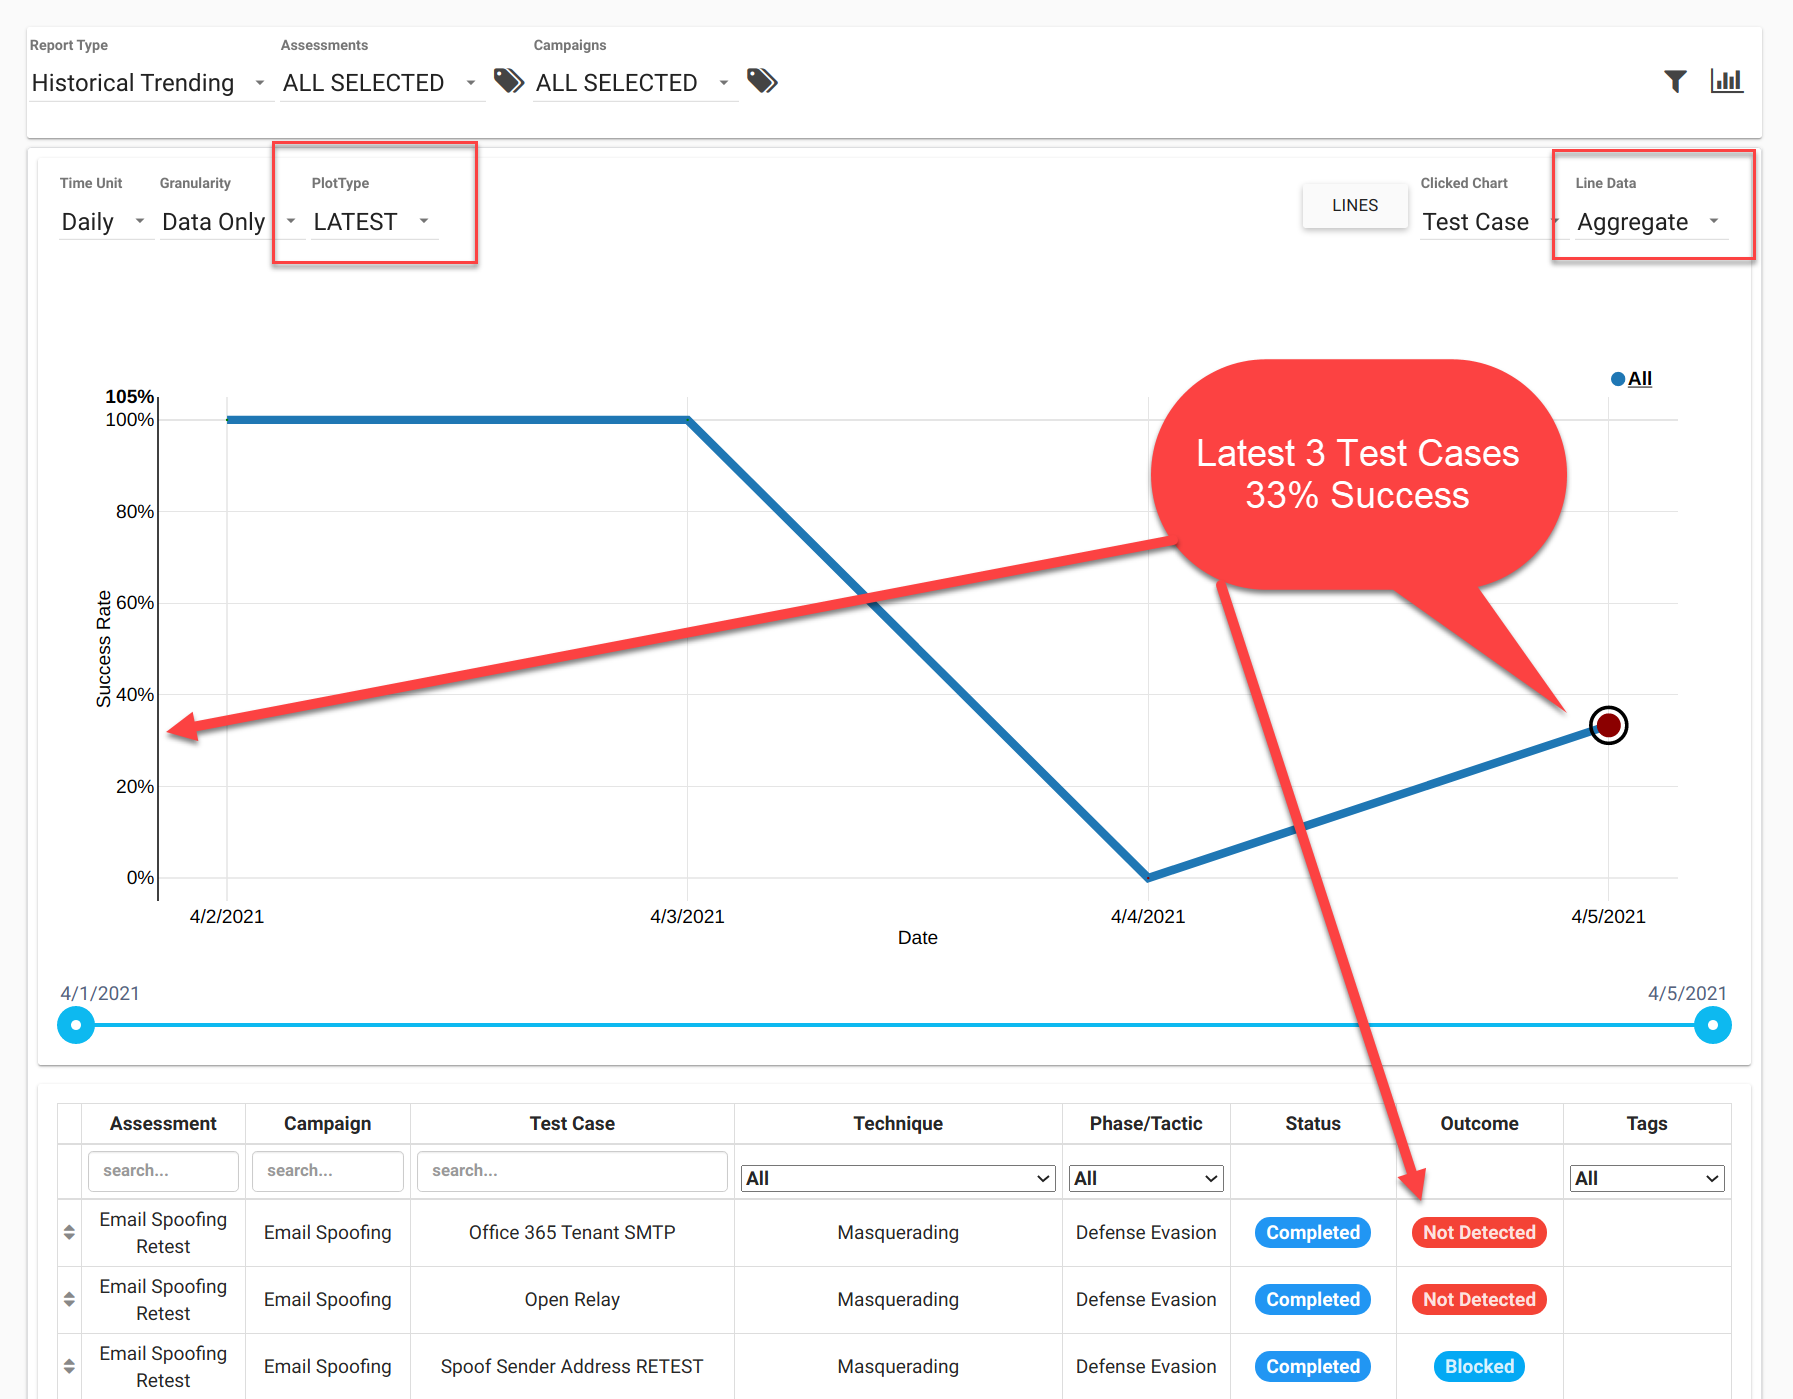
Latest Aggregate
Overall Cumulative
Latest Cumulative